
MDF prices depend on more than the cost of wood fiber and resin. Board thickness, density, surface finish, emissions classification, production efficiency, and shipping arrangements all influence the final quotation. For importers, furniture manufacturers, and distributors, comparing prices without matching these specifications can lead to misleading cost estimates.
This market outlook examines finished MDF board prices, the main raw material and energy cost drivers, regional sourcing differences, and practical methods for comparing supplier quotations. It also explains how buyers can assess price changes, calculate cost per sheet or cubic metre, and manage purchasing risks when input costs or freight conditions change.
MDF Finished-Board Prices and Recent Market Signals
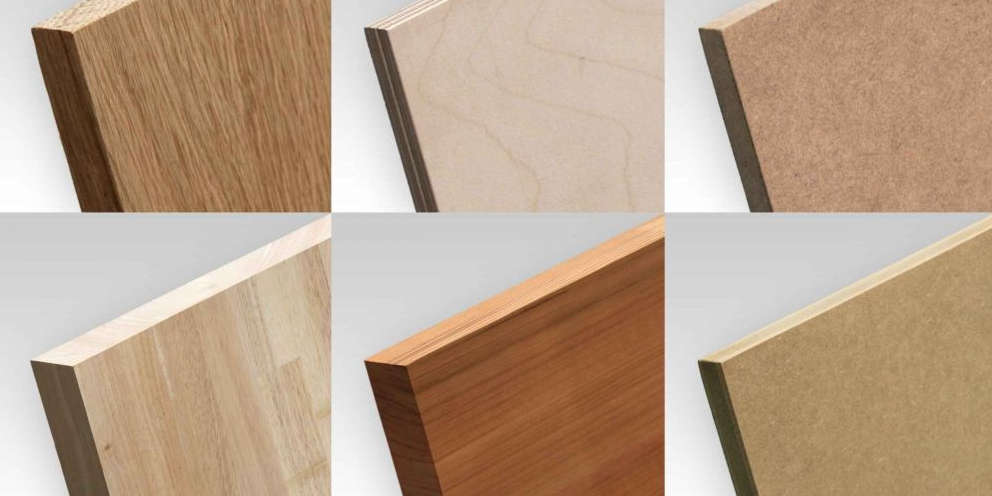
Finished MDF prices vary with board thickness, density, surface treatment, emissions classification, order volume, and delivery terms. A useful market comparison therefore requires more than a single price per sheet or cubic metre.
When collecting quotations from suppliers in China, Southeast Asia, Europe, or North America, record the quotation date, product specification, currency, minimum order quantity, and applicable trade term. Distinguish factory-gate prices from FOB, CIF, and delivered prices, as these include different cost components.
Compare the main product categories separately:
-
Standard raw MDF: Compare equivalent thicknesses, dimensions, density requirements, surface quality, and emissions classifications.
-
Moisture-resistant MDF: Confirm the specified product grade and test documentation before comparing its price with standard MDF.
-
Melamine-faced MDF: Include the decorative finish, surface quality, board thickness, and any special design requirements.
-
Veneered or specialty MDF: Account for veneer species, finish quality, surface treatment, and additional processing requirements.
Minimum order quantities and bulk discounts depend on the supplier, production schedule, product specification, and packaging requirements. Ask for quotation tiers at different order volumes instead of assuming a universal MOQ.
Signals to Monitor
Potential upward cost pressure: Increases in wood fiber, resin, energy, or freight costs may raise supplier quotations, particularly when manufacturers cannot absorb the additional expenses.
Potential downward pressure: Excess inventory, weaker orders, improved production availability, or more competitive freight rates may create room for negotiation.
These signals do not establish a market-wide price direction on their own. Confirm price movements through dated, comparable supplier quotations and relevant market data before adjusting purchasing plans.
Comparing MDF Prices Across Europe, Asia, and North America
Regional MDF prices reflect differences in manufacturing costs, product specifications, trade conditions, and distribution channels. A meaningful comparison should use equivalent products and the same pricing basis.
Asia: Buyers sourcing from China and Southeast Asia should compare factory capacity, board specifications, export packaging, minimum order quantities, and FOB quotations. Differences in density, emissions classification, and surface finish can materially affect the quoted price.
Europe: European quotations should be assessed against the relevant product specification, manufacturing origin, certification requirements, and delivery terms. A higher quotation may reflect differences in product grade, compliance documentation, or distribution costs rather than geography alone.
North America: Imported MDF prices, domestic mill quotations, and retail prices represent different stages of the supply chain. Retail prices typically include distribution and handling costs and should not be compared directly with export FOB quotations.
How to Build a Comparable Regional Price Benchmark
-
Select a reference specification, such as 18mm standard raw MDF with defined dimensions and density requirements.
-
Collect dated quotations from multiple suppliers in each target region.
-
Convert all prices to a common unit, such as USD per cubic metre.
-
Separate FOB, CIF, and delivered prices.
-
Add freight, duties, insurance, port charges, and inland delivery when calculating landed cost.
-
Compare like-for-like quotations over time to identify genuine price changes.
A regional price premium or year-over-year trend should be published only when the underlying quotations or price index are sufficiently comparable. Otherwise, present individual quotations as examples rather than representative regional benchmarks.
How Wood Fiber and Wood Chip Costs Flow Through to MDF Pricing
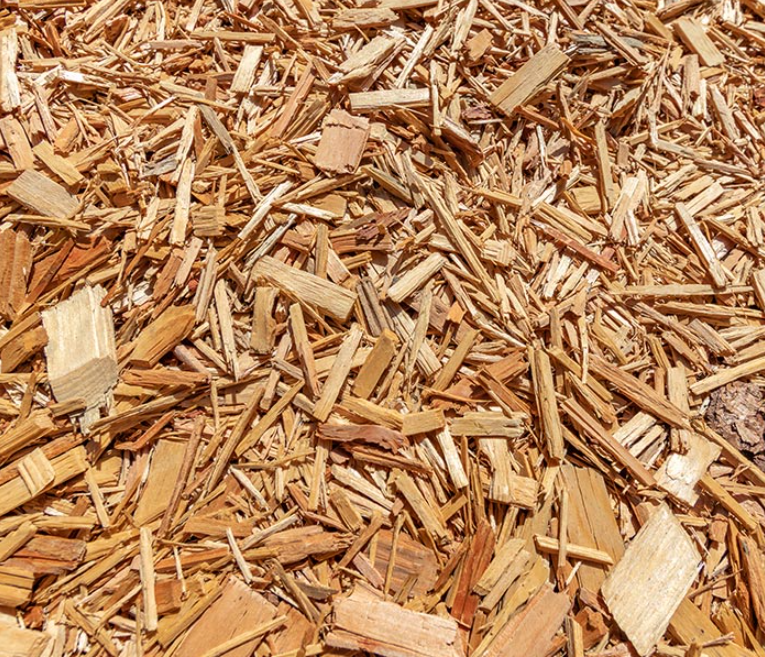
Wood fiber accounts for 50-60% of total MDF manufacturing cost, making it the primary factor on your invoice. Energy runs second at 20-25%, while resin, transport, labor, and depreciation split the rest. Because finished MDF contains 80-85% wood fiber by composition, shifts in raw fiber prices will reach your quote sooner or later.
The math is straightforward. When wood fiber costs jump 10% and the mill passes that through in full, total MDF manufacturing costs rise 5-6%. Across other price movements, a 5% fiber increase raises manufacturing costs 2.5-3.0%, while a 20% spike pushes them up 10-12%. Use these ratios to check supplier quotes during negotiations. If a quoted increase exceeds this range, look for resin, energy, freight, or currency shifts underneath.
In practice, theory meets friction. Raw wood chips (2-15mm) must go through chipping, thermal refining, drying, and screening before turning into usable fiber (0.1-2mm). Because of this conversion process, raw chip price swings do not transmit one-to-one. Equipment power draw, processing losses, and resin consumption can lag or amplify the original price signal.
Capacity utilization changes the equation too. When mills run above 85-90% capacity, they gain pricing power and pass cost increases through faster, sometimes adding more than the raw cost hike. Below that threshold, mills often absorb part of the hit by trimming margins or shifting sources instead of raising sheet prices right away.
Timing matters for your procurement calendar. Spot wood chip price spikes reach new orders and restocking quotes quickly. Long-term supply contracts lag by a quarter or more through scheduled repricing intervals. High mill inventory can delay pass-through by weeks or months, but once that stock clears, price increases land harder and faster on your next order.
Freight compounds the whole picture. Ocean shipping accounts for 8-15% of landed MDF cost on major trade lanes. When wood fiber costs rise alongside shipping rates, the initial FOB increase multiplies by the time it reaches CIF landed pricing. Check both numbers before locking in a container booking on assumptions.
UF/MUF Resin, Methanol and Urea Price Changes

Methanol broke out of its usual range. China’s national average for premium-grade methanol stood at 3,035.8 RMB/ton in early April 2026, then climbed to 3,379.1 RMB/ton by early September, marking a 505.9 RMB, 17.6% surge in a single month-over-month comparison. By October 9, Taicang spot prices rose further to 4,715–4,950 RMB/ton, up another 315–450 RMB from late September. Methanol feeds directly into formaldehyde production, and formaldehyde drives UF/MUF resin costs. That price pressure transmits quickly, with coastal markets moving ahead of inland regions.
Urea followed the opposite track. Early April pricing held flat at 1,882.1 RMB/ton before sliding to 1,771.9 RMB/ton by September, about 110 RMB below spring levels. On October 9, spot prices held near 1,777.5 RMB/ton, and producer Hualu Hengsheng trimmed quotes to 1,745 RMB/ton the following day.
Net effect on resin pricing: Methanol gained 11.3% from April to September while urea fell 5.9% over the same window. Because formaldehyde accounts for a larger share of UF/MUF formulations than urea, resin margins compress even as urea softens.
Procurement guidance: When methanol crosses 3,300–3,500 RMB/ton, shorten resin quote validity and add formaldehyde-linked escalation clauses. When urea trades in the 1,750–1,900 RMB/ton band, lock pricing or stagger purchases to hedge short-term swings.
How Energy, Transport, and Environmental Regulations Shape MDF Production Costs
Energy drives the bottom line on every MDF invoice. EPD data shows manufacturing accounts for roughly 83% of lifecycle global warming impact, 90% of acidification, and 86% of eutrophication. The plant floor drives most of this environmental and cost burden. Each cubic meter of MDF requires an energy mix of roughly 54% fossil, 6% nuclear, and 40% renewable. Drying, fiber preparation, and hot-pressing draw the most power, so any rate hike in natural gas or electricity hits these three stages first and raises panel production costs. Mills running biomass boilers and wood-waste feedstock cut fossil exposure significantly. In one LCA comparison, a wood-waste, low-electricity setup delivered the best ecological performance in its category. Bagasse-and-phenolic alternatives performed even better on resource depletion, scoring 45% lower than conventional MDF at 10.1 kg ore equivalent.
Freight hits heavier boards hardest. A 25mm sheet weighs 80-100 lb versus 30-40 lb for 6mm stock, and thicker panels take up space less efficiently per cubic meter. Trucking over 500 km adds 10-20% to the base price, while 1,000 km pushes that markup to 20-40%. Rail runs cheaper at 5-10% and 10-20% for those same distances. On a 20-ton, $20,000 order, a 500 km truck route alone can add $1,000-2,000. Ocean freight to the US West Coast runs $3,000-5,000 per TEU before port fees, drayage, insurance, and duties enter the equation. Base your purchasing decisions on landed cost per cubic meter rather than the FOB quote, because container utilization and factory-to-port distance shift the final expense far more than the initial board price.
Environmental compliance adds a third cost layer. Meeting formaldehyde-emission standards like E0/NAF, CARB Phase 2, EPA TSCA Title VI, and EN 13986 raises resin formulation, testing, and traceability costs, though it protects against export rejections. Resin choice shifts these numbers as well. In one LCA case, melamine-formaldehyde formulations produced 15% higher ecotoxicity (1.5×10⁸ PDF m³·d) than baseline UF systems—a tradeoff worth flagging during supplier audits.
Procurement checklist for your next supplier RFQ:
Energy source mix and electricity/heat consumption per m³
Resin type, formaldehyde class, and EPD/carbon footprint documentation
Factory-to-port distance and container loading efficiency
Transport mode (truck vs. rail) and compliance certificates
Calculate landed cost using this formula: ex-works price + energy surcharge + inland freight + ocean/rail + port fees + insurance + duties + compliance certification. Prioritize mills with high biomass shares, stable wood-waste sourcing, low electricity draw, and direct access to rail or port infrastructure. That combination provides the strongest buffer against supply shortages and yields the lowest total landed cost.
Seasonal Demand, Supply-Demand Balance, and MDF Market Outlook
Global production figures show growth running well ahead of demand. MDF output is forecast to climb from 121.87 million m³ in 2025 to 126.45 million m³ in 2026, then expand at a 3.76% CAGR through 2031 to reach about 152.05 million m³. The Asia-Pacific region controls 60.3% of 2025 global volume, supported by housing policies and furniture manufacturing growth in India and Vietnam. Furniture production alone accounts for 51.1% of global MDF demand (roughly 62.28 million m³), with cabinet doors, drawer fronts, and shelving panels outpacing the wider market at a 4.04% growth rate through 2031.
Seasonality still sets the rhythm. Q1 stays soft every year. Slow construction starts and cautious furniture purchasing held 2025 US demand growth to 1.1% year over year, at roughly 667 million sq ft. Spring typically brings a rebound, but 2025 underdelivered and generated no meaningful price lift. Real movement waited until the second half, when prices climbed because of Vietnam’s anti-dumping actions on Chinese and Thai MDF imports, tighter energy expenses, and a reduced flow of cheap product.
Supply-demand balance remains loose in key markets. North American MDF production has run below nameplate capacity since late 2022, leaving 2024–2025 demand-to-capacity ratios below 70%. US demand rose 4.6% in 2025, but total consumption stayed under 2.9 billion board feet, which was not enough to clear the overhang. India shows a comparable pattern: demand grows over 10% a year, yet capacity expands faster. Capacity utilization among major Indian producers dropped from ~80% in FY2022 to ~66% in FY2025, and some new plants are aiming for just 40–50% utilization in FY2026.
Price direction splits by half-year. North American prices are projected to decline 2.0–2.5% in 2025 and around 1.0% in 2026, with an early slump followed by an H2 recovery. Combined transport and energy costs are up 19% since 2022, which puts a firm floor under any steeper drop.
What This Means for Procurement Timing
Base case: 3–4% annual global growth, with furniture and cabinet demand outperforming construction panels.
Oversupply case: Sub-70% utilization persists across India and North America, keeping margins compressed (India’s sector margin stays near 10%).
Tight case: Anti-dumping enforcement and rising fiber and energy costs generate regional shortages and H2 price spikes.
Structure framework agreements around “cheap in Q1, tight in H2,” using escalation clauses tied to wood fiber, resin, and energy indices. Keep a direct eye on monthly utilization rates, import volumes, cabinet plant starts, and anti-dumping rulings—these four indicators turn long before headline MDF pricing moves.
Price Premiums and Cost Conversion Across Different MDF Product Specifications
Not all MDF is priced the same, and the wide spread between grades catches many buyers off guard. In early 2026, the Asian benchmark for 18mm, E1 moisture-resistant MDF (720–780 kg/m³) sits at $480–580/m³. Upgrading to E0 grade with a density above 800 kg/m³ and a sealed surface pushes that range to $650–780/m³. China’s domestic market shows a matching pattern: Q2 2026 prices averaged $555/ton, which works out to about $416/m³ at 750 kg/m³ density, or 2,995 RMB/m³ at a 7.2 exchange rate. Export platforms quote standard MDF much lower, between $180 and $280/m³, but thickness, core density, glue grade, and MOQs (frequently 20 m³ minimum) swing those figures fast.
Converting cubic meters to sheet cost uses this formula:
Price per m³ × length (m) × width (m) × thickness (m) = cost per sheet
For a standard 1220×2440mm sheet (2.9768 m² face area):
|
Thickness |
Volume |
At 3,000 RMB/m³ |
At 4,000 RMB/m³ |
At 5,000 RMB/m³ |
|---|---|---|---|---|
|
6mm |
0.01786 m³ |
54 RMB |
71 RMB |
89 RMB |
|
9mm |
0.02679 m³ |
80 RMB |
107 RMB |
134 RMB |
|
12mm |
0.03572 m³ |
107 RMB |
143 RMB |
179 RMB |
|
15mm |
0.04465 m³ |
134 RMB |
179 RMB |
223 RMB |
|
18mm |
0.05358 m³ |
161 RMB |
214 RMB |
268 RMB |
|
25mm |
0.07442 m³ |
223 RMB |
298 RMB |
372 RMB |
Premiums stack across specific product attributes:
High-density boards: +20–30% over standard density, or $10–20/sheet
Moisture-resistant (MR-MDF): +25–35% over interior-grade stock
Waterproof/high-performance MR boards: +20–50%, with sealed 18mm sheets running $60–90 versus $30–50 for standard
E0/formaldehyde-free: +10–15% on top of MR pricing, driven by adhesive and testing costs
Fire-retardant MDF: 16mm sheets run $65–75 versus $28–35 for standard CARB2 stock
Ultra-smooth/paint-grade surfaces: +10–25%, with density often exceeding 60 lb/ft³ against 45–50 lb/ft³ standard
Technical-grade combo (E0 + ≥800 kg/m³ + sealed surface): 35–60% cumulative premium, landing at $650–780/m³
For cost modeling, raw substrate makes up 70–85% of the finished sheet price. Each 100 kg/m³ jump in density adds 10–20% to your base cost. Moisture resistance multiplies base pricing by 1.25–1.35x, and E0 treatment adds another 10–15% on top of that. For fire-retardant stock, budget 1.8–2.5x standard board rates. Factor in cutting waste as well: 8–15% for full-sheet ripping, and 15–25% for irregular shapes with low nesting efficiency. Order volume remains the heaviest lever on unit price. Export MOQs run 480–2,000 sheets, but buying above 20 m³ puts you much closer to factory-gate rates.
Procurement Cycle and Price Risk Management Plan
Treating MDF procurement as a one-off purchase hides where money actually leaks. Lead times, internal sign-off delays, and unhedged market exposure bleed margin well before stock reaches the receiving dock. A disciplined schedule and clear risk boundaries prevent those losses.
Benchmark your procurement cycle against these KPIs:
|
Module |
Target Benchmark |
Management Action |
|---|---|---|
|
Order cycle (catalog items) |
<1 day |
Catalog pricing, auto-approval |
|
General procurement cycle |
2–5 days |
Tiered authorization by order value |
|
Supplier OTD |
≥95% (critical parts ≥98%) |
Monthly scorecards, contract-embedded |
|
OTIF |
>97% |
Separate scoring for shortfall vs. delay |
|
Price variance (PPV) |
±2% of budget baseline |
Index-linked pricing, competitive bidding |
|
Domestic lead time |
3–10 days |
Set safety stock via P50/P80/P95 |
|
Ocean freight lead time |
35–60 days |
Buffer 20–30% for cross-border volume |
Divide the entire cycle into distinct stages: demand, approval, RFQ, production, transport, and inspection. Track at least 12 months of order history, using P80/P95 percentiles and coefficient of variation instead of simple averages. Set delivery alerts at 1–3 days overdue (yellow), 4–7 days (orange), and 7+ days (red).
Dual-sourcing structure: Allocate 60–70% of volume to a primary mill and 30–40% to a backup. If a mill drops below 95% OTD for two consecutive quarters, reallocate its share.
Price Risk Hedging Framework
Classify raw materials by volatility:
High volatility (resin inputs, energy, freight): index-linked pricing, staggered lock-ins, dual sourcing
Medium volatility (packaging, standard hardware): semi-annual agreements, price ceilings
Low volatility (MRO, mature standard parts): annual framework pricing
Lock-in schedule for timber supply chain and resin inputs:
Next 1 month: lock 80–100%
Next 2–3 months: lock 50–70%
Next 4–6 months: lock 20–40%
Cap single lock-in batches at 30–40% of projected monthly demand. Keep futures volume matched strictly to actual monthly grade and volume needs.
Escalation triggers:
Price variance >5%: joint review by procurement and finance
Price variance >8%: pause non-essential buys, evaluate alternate specs
Single-supplier share >70%: flag as concentration risk, certify second source
Unlocked exposure >50% of 3-month budget: initiate batch lock-in or index contracts
MDF Supplier Quotes and Cost Budget Data Sheet
Eight supplier quotes from current sourcing channels show how wide prices spread once you factor in MOQ and certification requirements.
|
Supplier |
Product |
Quote |
MOQ |
|---|---|---|---|
|
Linyi Consmos Wood Industry |
18mm waterproof raw MDF |
$3–12/sheet |
200 sheets |
|
Heze Qingfa Enterprises |
Multi-thickness furniture MDF |
$3.50–6.20/sheet |
500 sheets |
|
Linyi Dituo International Trade |
18mm E0/E1 melamine-faced |
$5–13/sheet |
400 sheets |
|
Lianyungang Longyi Industry |
1.8–5mm thin HDF/MDF |
$1.80/sheet |
3,000 sheets |
|
Linyi Qiute Import/Export |
7×8ft, 7×9ft E1/E2 melamine |
$22–28/sheet |
100 sheets |
|
Qingdao Everise Int’l |
12/15/18mm waterproof/veneer |
$180–230/m³ |
25 m³ |
Run these three formulas before confirming any order:
– Sheet value = quantity × unit price
– Volume = length × width × thickness × quantity
– Landed cost = sheet value + packaging + inland freight + ocean freight/insurance + duties + port fees
Reserve 3-5% waste on standard cuts and 5-10% on CNC or irregular profiles. Always request both per-sheet and per-m³ pricing to catch loading discrepancies.
Conclusion
Resin volatility, tightening timber supply chains, and regional energy cost gaps drive today’s medium density fiberboard price swings, and they will not settle down anytime soon. Procurement teams watching MDF raw material prices need to treat this quarter as an active planning window. Lock in resin contracts before UF/MUF pricing catches up to methanol and urea gains, diversify wood chip sourcing across regions to hedge against localized shortages, and build seasonal demand curves into your negotiation schedule instead of reacting to quotes after the fact.
This market outlook gives you an immediate bargaining advantage. Pull your latest supplier quotes, run them against the cost breakdowns above, and identify where you are overpaying relative to regional benchmarks. Buyers who act on data this month will out-negotiate anyone still waiting for stable pricing that will not come.