
Nobody in your supply chain can tell you with a straight face whether you should lock in OSB volume today or wait three months for a pullback. Prices have moved enough in both directions over the past two years that watching the market is a guess dressed up as patience.
This OSB market outlook replaces that guesswork with concrete data. We track 1.775 billion square feet of annual capacity exiting North America, map how that supply contraction collides with housing starts data on a lagged timeline, and translate the balance into a forecast range for the next 3–12 months. You also get region-by-region price risk for the South, Southeast, and Western Canada, a North America-vs-Europe comparison, and base, bull, and bear scenarios built for procurement timing across the wood panel industry.
Latest OSB Price Signals and the 3–12-Month Forecast Range
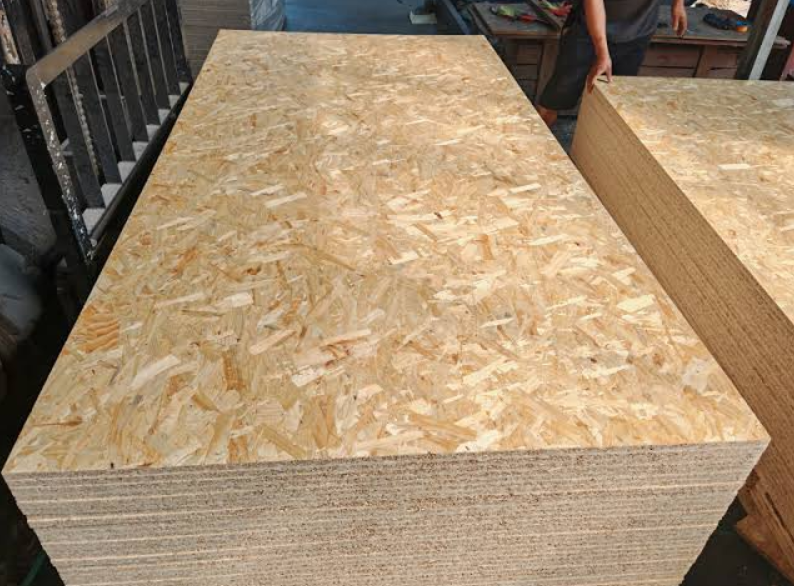
Canadian OSB sits at US$343/MT for Q2 2026, down 1.2% from US$347/MT in Q1. The shift is small, but the market drivers behind it tell a clearer story than the headline print.
Builders remain conservative with residential construction quiet, and distributors continue to trim warehouse inventory rather than order ahead. Because mills have ample volume on hand to cover this slower pace without pushing quotes higher, pricing holds at soft-to-stable.
Across international markets, Brazil is at US$363/MT, China at US$457/MT, Germany at US$570/MT, and Spain at US$604/MT. North America remains the lowest-cost producing region, giving buyers a solid baseline when weighing import options against global osb vs plywood price trends.
At U.S. supply yards, 7/16-in. 4×8 sheathing sells for US$9–14/sheet, 15/32-in. panels run US$11–16/sheet, and tongue-and-groove subfloor panels (19/32-in. to 23/32-in.) range from US$22–38/sheet depending on thickness.
The Forecast Range You Can Actually Plan Around
|
Horizon |
Signal |
Indicative Range |
|---|---|---|
|
3 months |
Sideways to lower; conservative builder inventories |
US$330–355/MT |
|
6 months |
Seasonal construction pickup could lift prices |
US$335–375/MT |
|
12 months |
Widens based on housing starts, mill outages, supply discipline |
US$325–410/MT |
These price targets build off the current US$343/MT baseline, factoring in historical panel volatility of −5% to +10% over three to six months and −5% to +20% across twelve months.
Bull case: A rebound in housing starts, storm-repair buying, stronger export demand, or an unplanned mill outage pushes Canadian pricing toward US$390–410/MT within the year.
Bear case: Elevated mortgage rates, sluggish residential building, full distributor yards, or prolonged hand-to-mouth buying drag prices down to US$325–335/MT.
Procurement takeaway: Budget US$340–365/MT for contract commitments over the next 3–12 months, holding a ceiling near US$400/MT to cover regional supply disruptions. For U.S. 7/16-in. sheathing, expect US$10–15/sheet under balanced conditions and US$16–20/sheet during short-term mill pinches.
Track these monthly: Canadian OSB benchmark prices, U.S. housing starts and permits, distributor stock levels, mill run rates and curtailments, import volumes, and panel futures. Those indicators will reset this price corridor before the next quarterly index confirms it.
Supply Contraction: 1.775 Billion Square Feet of Annual Capacity Exiting North America
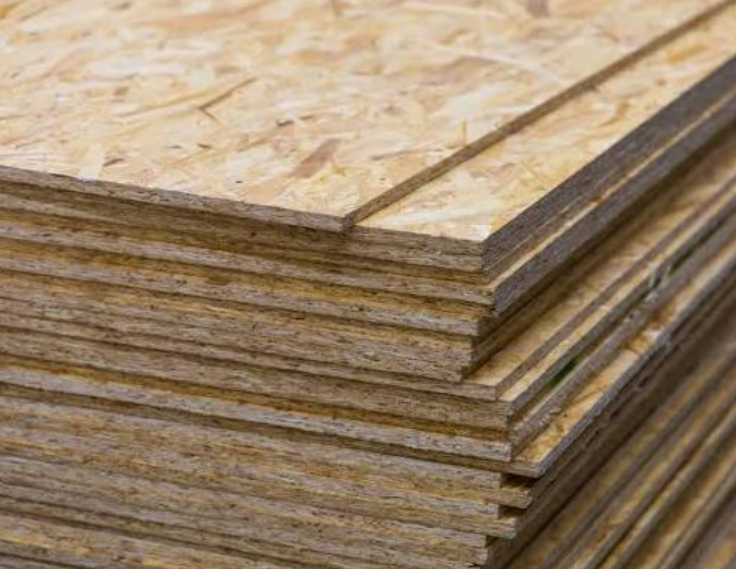
Mill closures rarely show up in a single headline number. Converting roughly 1.8 million short tons of shuttered North American board capacity at the standard industry benchmark of 1,000 square feet per ton yields the headline estimate of 1.775 billion square feet. That baseline offers a clear starting point, but it understates the total reduction. Documented 2025 closures across containerboard and corrugated producers sit closer to 3.9 million tons, or about 3.9 billion square feet annually, which more than doubles the initial estimate.
Where the Capacity Actually Disappeared
International Paper: ~1.8 million tons closed, including the 800,000-ton Red River mill
Georgia-Pacific: 1 million+ tons removed through the Cedar Springs shutdown
Smurfit WestRock: ~600,000 tons eliminated across several facilities
Combined, International Paper and Smurfit WestRock cut over 1.3 million tons and affected more than 1,300 jobs
Those cuts take out 5.5–10% of the 40–42 million-ton North American containerboard base, down from 44–46 million tons. Analysts project another 3 million tons—about 3 billion square feet—could exit by 2027. Since 2015, at least 81 mills representing 20.7 million tons have shut permanently or indefinitely.
Why This Matters for Panel Buyers
Operating rates are climbing from 90–91% in 2023–24 toward 95% by early 2026 as production tightens. U.S. output already fell 3.1% year over year in Q3 2025. For osb mill capacity and the broader wood panel industry outlook, this contraction brings familiar supplier discipline. Buyers face fewer producers, smaller margins for error, and genuine exposure to freight and allocation volatility when buying from a concentrated mill base.
New OSB Mill Capacity and the Timing of Supply Relief
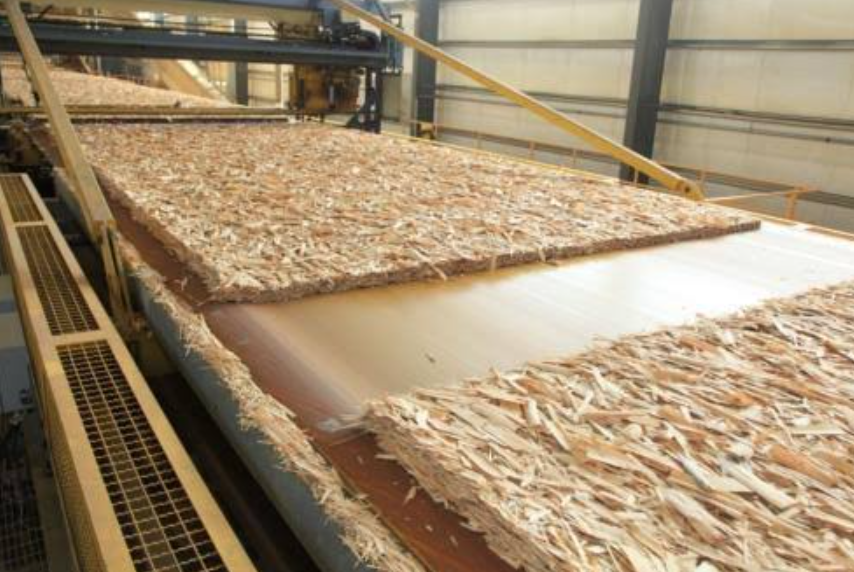
Mill closures and new capacity are moving on very different schedules. Procurement teams need to model the timing gap between them before locking in contracts.
Over the five years through 2024, OSB producers added roughly 1.3 billion square feet (3/8-inch basis) of capacity, a 5% increase. Announced projects could push that to 4 billion square feet by 2026, a 15% jump from the existing base. Still, announced capacity and running mills are two very different things.
What’s Already Online
Some relief has already reached the market:
H2 2024 startup: ~600 million sq ft/year, already running, and the earliest incremental supply buyers can count on
RoyOMartin Corrigan, Texas: $211 million expansion completed October 2024, lifting capacity to ~1.4 billion sq ft (+75%, +300 jobs)
West Fraser Allendale, SC: Restart began Q2 2023, now contributing ~700 million sq ft/year
What’s Coming in 2026
Huber Engineered Woods, Shuqualak, MS: New mill targeting Q2–Q3 2026 operations
Kronospan, Eastaboga, AL: $350 million investment, startup planned for 2026
RoyOMartin, Corrigan (phase two): $115 million project adding ~70% more capacity, no confirmed commercial date yet
The Offset Nobody’s Pricing In
Gross additions overstate net relief. West Fraser plans to curtail its High Level, Alberta mill in spring 2026, removing 860 million sq ft of Canadian supply. Its Cordele, Georgia line remains idled, sidelining another 440 million sq ft. Combined, that pulls 1.3 billion sq ft off the market right as new mills ramp up.
The actual supply wave will not land until mid-to-late 2026. Even then, commissioning, product qualification, and distribution ramp-ups mean nameplate capacity will not turn into shelf-ready volume right away. Budget for tight supply through at least Q2 2026.
OSB Supply and Demand Balance: The Three-Driver Price Model
Capacity numbers alone do not move OSB prices. Mill operating rates, distributor inventories, and builder orders have to line up together. Miss one, and the forecast falls apart.
Residential construction drives 62%+ of total OSB consumption, so housing starts set the demand floor. U.S. starts landed near 1.46 million units in 2025. NAHB projects 1.52 million for 2026, a 4% bump that sounds bullish until you factor in the lag. Builders and distributors draw down existing inventory before placing new mill orders, which is why a recovery in starts does not translate into an immediate price lift. Understanding OSB specifications early can help buyers avoid costly purchasing mistakes.
Single-family starts slipped to 253,000 in the June quarter, down from 264,000 a year earlier. Multifamily picked up slack, rising to 119,000 from 111,000. Single-family builds carry heavier OSB intensity per unit, so this mix shift matters more than the headline number suggests.
On supply, Arbec’s Amos, Quebec mill has gone indefinitely idle, adding to eastern Canada’s capacity losses. Meanwhile, RoyOMartin’s expanded Corrigan facility is running at roughly 70% of design capacity—proof that nameplate additions do not equal real output, much like OSB grade stamps don’t always reflect real performance.
Three Scenarios, One Decision Point
Bullish: starts rise, inventories fall, and mills curtail, pushing prices up.
Bearish: starts weaken, inventories build, and mills run full, softening prices.
Neutral/volatile: demand stays weak, but closures absorb the slack and cap downside.
Right now, we’re sitting in that third scenario, with supply discipline offsetting demand destruction.
Housing Starts, Home Sales, and the Lagged OSB Demand Effect
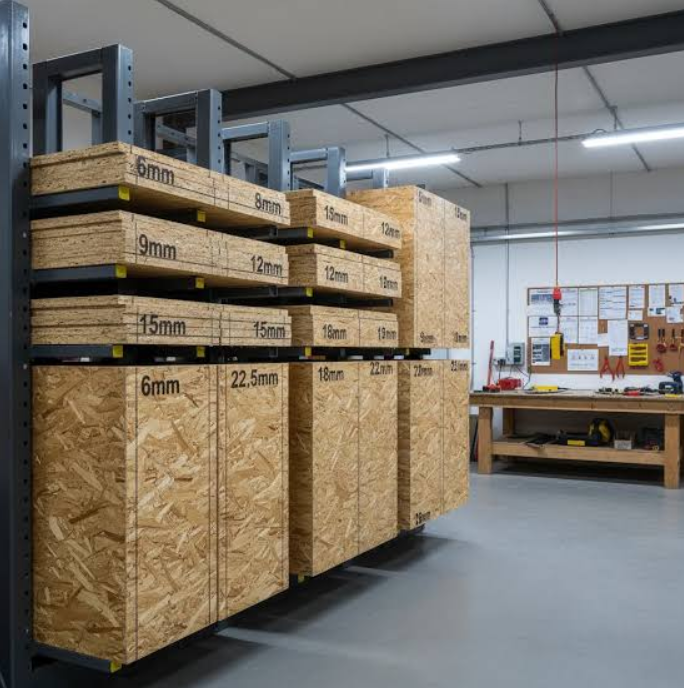
LP Building Solutions tracks U.S. housing starts as its main external demand signal because starts align with OSB consumption far better than other housing metrics.
The 2025 baseline was rough. Total housing starts landed near 1.36 million units, with single-family starts down an estimated 7% year-over-year per JBREC. Forecasts for 2026 split wide. Fannie Mae projects a 3.7% total decline (single-family down 3.0%, multifamily down 5.2%), while Morningstar expects single-family starts to grow 3%. Pick your analyst, get a different answer.
Home sales tell a separate story. Fannie Mae projects 4.9 million total home sales in 2026, including 707,000 new single-family sales, up 3.7%. NAR forecasts existing-home sales rising 14%, but resale activity does little for OSB demand because existing homes do not require new structural panels.
The Lag You Need to Model
OSB demand does not move in the same month as sales. It follows this sequence:
Sales improve as rates and incentives shift
Builders convert contracts into permits and starts
Framing begins, usually 1–3 months after the start
Full market response takes 2–4 months once mill shipments are factored in
That timeline explains LP’s Q1 2026 results. OSB net sales fell $99 million year-over-year on lower prices and volumes, absorbing the delayed fallout from weaker 2025 starts.
For procurement, rank single-family starts first, permits second, and framing-stage orders third. Treat new-home sales as a 2–6 month leading indicator, and view existing-home sales as sentiment noise that will not drive volume.
U.S. South, Southeast, Western Canada, Midwest, and Northeast Price Risks
Freight, fuel, and rail capacity drive regional OSB prices as much as mill output does, and five North American regions face distinct exposures right now.
U.S. South: Fuel and logistics costs tied to Southern lumber corridors have climbed 20%–40% alongside broader input inflation. Gulf-dependent mills face compounding freight risk whenever diesel or rail surcharges spike mid-contract.
U.S. Southeast: Gulf shipping costs remain high. Benchmark port pricing jumped from $389 to roughly $450/ton, a 16% increase year over year. That terminal congestion directly hits panel shipments moving through New Orleans and Savannah.
Western Canada: Export logistics and rail allocation are the primary bottlenecks. Restricted nitrogen supply chains through 2026–27 tie up the same rail cars and port terminals needed for Western Canadian OSB export shipments.
U.S. Midwest: Production input costs remain near twice the 2019 average, showing that industrial costs across the region have not normalized. OSB resin and wax inputs face that same lag.
U.S. Northeast: Heavy reliance on inbound freight leaves delivered panel costs vulnerable to fuel and freight swings. In response, buyers are securing regional storage and diversifying supplier contracts ahead of spring demand.
North America Versus Europe: Regional OSB Market Trends and Price Transmission
North America and Europe operate on two different price engines. North America accounts for 45.3% of global OSB revenue (USD 12.96 billion), while Europe holds 27.4% (USD 7.84 billion). That scale gap shapes how each market behaves.
North America follows housing cycles. About 95% of production goes into construction, and 65% of consumption ties to residential building. Because of that exposure, housing starts, mill curtailments, and dealer inventory levels swing prices fast. Europe depends more on fiber costs, energy prices, and renovation demand, with 50% tied to residential use.
The Q3 2025 pricing gap illustrates the difference. Canada sat at US$330/MT while Germany reached US$552/MT. That US$222/MT spread put Germany 67% higher, well above the historical 15–25% premium cited in industry benchmarks.
Sourcing takeaway: Use Canada and U.S. benchmarks for cyclical exposure with shorter, formula-linked contracts. Use Germany, Poland, Romania, or Nordic suppliers for European baselines, but normalize for grade, certification, and currency before comparing landed costs.
OSB Versus Plywood, Lumber Futures, and the Limits of the Futures Market

Plywood costs real money compared to OSB. In 2026, 7/16-inch OSB runs $14–$20 a sheet against $28–$52 for 1/2-inch CDX plywood—roughly 55% more expensive. Subfloor follows the same pattern, with 23/32-inch OSB sitting at $25–$35 a sheet versus $35–$50 for plywood. Regional premiums widen even further across the Southeast (60–75%), Texas (65–80%), and the Midwest (70–85%). On a 2,000-sq-ft home, switching to OSB saves $1,500–$3,000.
Don’t lean on lumber futures to hedge any of this. CME contracts deliver 27,500 board feet of random-length 2×4 lumber, which offers no direct pricing match for OSB or plywood. Framing lumber trades in $/mbf, while panels price by the sheet or thousand square feet. A $10/mbf move shifts contract value by $275, but that doesn’t translate cleanly to 7/16-inch sheathing or AdvanTech subfloor costs. Use futures as a general directional signal, then track regional panel quotes, mill lead times, and OSB-plywood spreads on their own. Basis risk is real, so build your procurement plan directly on panel data.
Base, Bullish, and Bearish OSB Price Scenarios for Procurement Planning
Three numbers should drive every OSB purchase order you sign this quarter: $9, $11, and $15. These sheet prices separate a buyer’s market from a seller’s market, and knowing which side you are on changes how much volume you should lock in today.
Using the Q1 2026 benchmark of $8–$12 per 4×8 sheet (7/16-in., with $2–$3 regional swings from freight and mill proximity), here is how a $10 baseline maps to purchasing decisions:
|
Scenario |
Price Range |
Vs. Baseline |
Procurement Move |
|---|---|---|---|
|
Bearish |
$8–$9 |
−20% to −10% |
Cover 30–45 days only; get spot bids from 3+ distributors |
|
Base |
$9–$11 |
−10% to +10% |
Lock 50–70% via blanket orders; rebid remainder monthly |
|
Bullish |
$12–$15 |
+20% to +50% |
Pre-buy 70–100% for 60–90 days; secure allocation, not just quotes |
For 100,000 sheets, that price spread is the difference between an $0.8 million and a $1.5 million line item—nearly double.
Market data backs up these ranges. North Central 7/16-in. OSB analyst forecasts cluster around $425–$460/MSF, while SPF lumber trades at $475–$535/MBF with a 30–60-day lag before OSB catches up. West Fraser’s 2026 shipment target of 5.9–6.3 billion sq ft against “somewhat softer” demand signals steady base-case discipline.
Bullish contingency rule: add 20–30% above base price, or 50% if your project touches outage- or transport-exposed regions.
OSB Inventory Levels, Mill Operations, and Weekly Signals to Track
Shipment data gives you the clearest real-time read on where this market is headed. West Fraser’s Q1 2026 North American shipments reached 1,544 million sq. ft. (3/8-in. basis), up from 1,512 million in Q4 2025 as operating rates improved. Full-year 2026 guidance sits at 5.9–6.3 billion sq. ft., down from 6.345 billion in 2025. That supply is shrinking even before you factor in mill curtailments.
Mill Curtailments Reshaping the Supply Base
Three mill closures now take 1.775 billion sq. ft. of annual capacity out of the market:
-
West Fraser, High Level, Alberta: curtailed indefinitely at the end of April 2026, removing ~860 million sq. ft.
-
West Fraser, Cordele, Georgia: line remains idled.
-
Louisiana-Pacific, Jasper, Texas: curtailing ~475 million sq. ft. starting October 2026.
New capacity offsets part of that drop: a 2024 greenfield expansion added 600 million sq. ft., and West Fraser’s restarted Allendale, SC mill contributes another 700 million sq. ft.
How to Read Inventory Without Official Weekly Data
Public OSB inventory figures are not published weekly like lumber futures volumes. You have to read the market position through buyer and mill behavior:
-
Tight: order files stretch out, lead times lengthen, distributors buy ahead of need, and prices climb across multiple regions.
-
Balanced: steady order files, normal rail and truck availability, few spot discounts, and flat prices.
-
Excess: distributor inventories climb, lead times shrink, buyers cancel orders, mills take downtime, and discounts widen.
Your Weekly Tracking Checklist
Track weekly OSB assessments from Random Lengths or Fastmarkets, which cover over 1,600 lumber and panel items by region, thickness, and delivered basis. A single week of pricing rarely tells you much. Watch the multi-week patterns instead:
-
2–3 consecutive weeks up: tightening supply or improving orders
-
2–3 consecutive weeks down: excess inventory or weak demand
-
Regional divergence: freight bottlenecks or uneven mill outages
Monitor these fields weekly: mill utilization, planned and unplanned downtime, order-file weeks, distributor inventory days, rail and truck lead times, and shipment trends against the prior quarter.
The clearest warning sign is shipments and prices falling together. West Fraser flagged that exact combination—lighter seasonal demand alongside planned maintenance—heading into the High Level ramp-down. When both metrics slide at the same time, it signals excess inventory far more reliably than either metric on its own. That is when procurement teams should rethink timing before committing to volume.
Conclusion
The OSB market outlook for the next 6-12 months points to a base case of $380-$430 per thousand square feet. That range is driven by capacity exits (1.775 billion square feet gone), the 60-90 day lag effect on housing starts, and regional logistics bottlenecks, in that order of weight. If you’re buying for Q2-Q3 projects, the U.S. South and Western Canada carry the most upside risk, while new mill capacity won’t cool prices until late 2025 at the earliest. Buyers researching reliable wood panel manufacturers can review supplier capabilities for added context.
Don’t make the 2021 mistake of reacting to headlines instead of data. Track weekly mill operating rates and housing starts releases, which give you early warnings well ahead of any OSB price index update. If your project timeline has flexibility, locking in volume before the bullish scenario kicks in beats scrambling later. Understanding a supplier’s manufacturing background also supports long-term sourcing decisions.