
Plywood prices just moved again. If you’re pricing a bid or locking in Q4 inventory, that shift matters more than any headline number. Softwood plywood is running well above last year’s benchmark, OSB is trading at a spread that’s starting to shift specifier behavior, and mill capacity announcements in the Pacific Northwest are already rippling through October delivery quotes.
We’re breaking down the actual September 2026 price bands by grade and region, the four supply-side forces driving them, and a Q3–Q2 forecast range grounded in housing starts data and log futures. Then we hand you a three-indicator framework to decide, on your own, whether now’s the moment to buy or hold. Sourced, dated, and built for people who have to commit budget this quarter.
September 2026 U.S. Plywood Price Snapshot by Product, Grade and Region
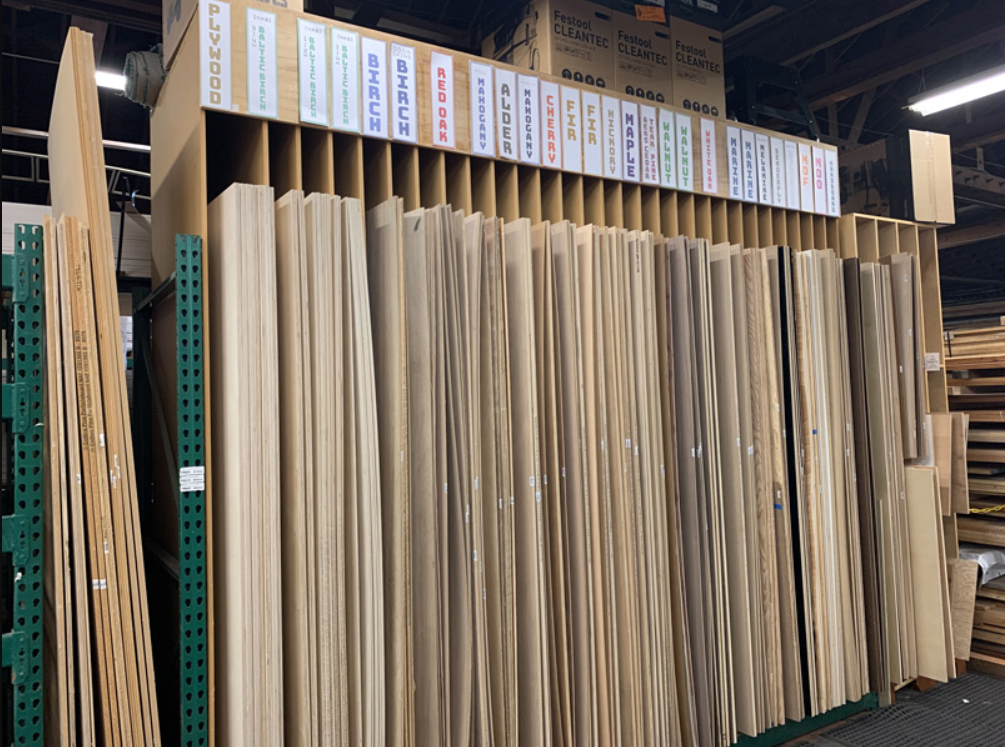
The broad Plywood Producer Price Index (WPU083) sat at 300.124 in August 2026, last refreshed September 10, the closest official read we have for the month. That single figure tells the macro story, but the grade-level breakdown is where the real budget decisions live.
Hardwood plywood is the standout mover. U.S. PPI data puts it at 171.64 in August, up from 168.14 in July and a sharp jump from 153.50 a year ago. That’s sustained upward pressure across three consecutive readings.
Softwood plywood pricing tells a similar but faster-moving story. The construction materials price index for soft plywood products climbed +2.1% month-over-month, +19.2% year-over-year, and a staggering +82.1% above pre-COVID levels. Zoom out further and the index is up 9.4% over the last four months and up 25% since last October. That’s structural repricing.
Import benchmarks add another layer. Hardwood plywood entering North America is running $730.28/m³ CIF, up 14.00% in the latest reading. Tropical plywood sits at $644.63/m³ CIF, up 13.28%. Yet U.S. hardwood plywood import volume dropped 9% in July — buyers are paying more for less supply moving through the door.
Regional gap: no public September dataset breaks this down by U.S. census region (Northeast, South, Midwest, West). The only granular benchmark available is North America-wide. If your supplier claims region-specific pricing data beyond that, ask where it’s sourced.
August 2026 Construction Demand Signals for Plywood Consumption
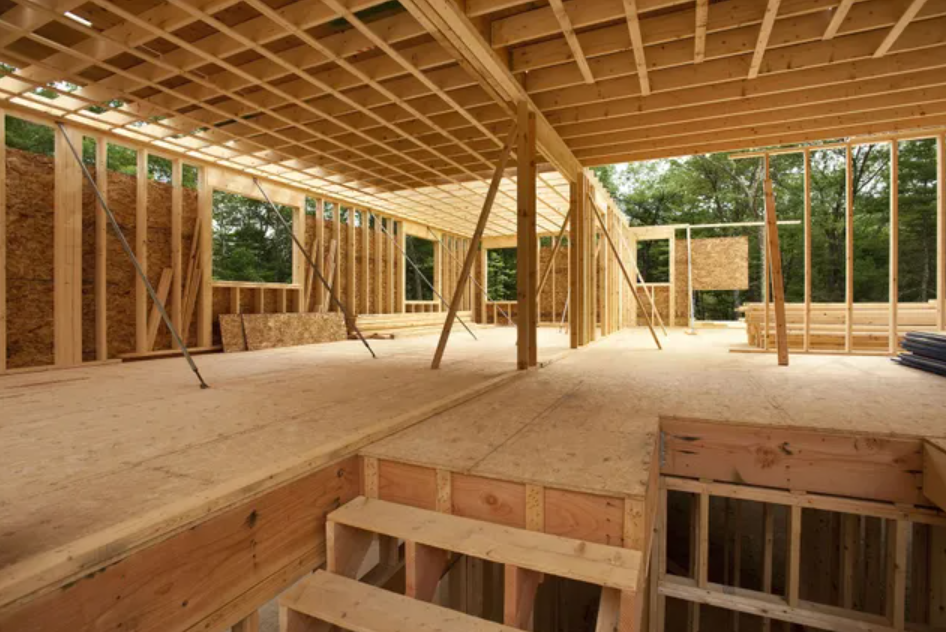
Housing starts tell a split story this month, and that split is exactly what matters for plywood demand forecasting. Total starts dropped to 1.275 million SAAR in August, down 2.6% month-over-month and 1.2% year-over-year. But the real signal is single-family starts, which jumped to 918,000 SAAR, up 7.6% MoM and 5.2% YoY. That’s the strongest plywood-positive metric in this dataset. Single-family framing eats plywood at a far higher rate per square foot than multifamily construction.
Permits tell a more cautious story. Single-family permits, your forward indicator, came in at 878,000 SAAR, down 1.8% MoM though still 1.3% above last August. Total permits fell to 1.394 million SAAR, down 2.7% MoM. Multifamily is the drag. 5+ unit permits hit 467,000 SAAR, down 3.1%, pulling less structural panel demand from apartment framing. Completions slowed sharply too, down 11.9% to 1.128 million SAAR, which delays interior finish and replacement-panel consumption.
Regionally, the West led. Starts were 323,000 SAAR, a 25.68% monthly jump, the biggest mover on the board. South stayed dominant in absolute volume at 658,000, followed by Midwest at 198,000 and Northeast at 96,000.
The net read is moderate near-term plywood demand, carried by single-family strength, softened by multifamily and completions weakness, against pricing that’s still climbing regardless.
Four Supply and Cost Drivers Reshaping the Plywood Market

Behind every price line on that PPI chart, there’s a cost input that doesn’t appear on any label. Four forces are moving plywood prices right now, each hitting a different point in the supply chain.
Timber and log supply is the tightest link. 22% of manufacturers flagged raw material cost volatility and limited log availability as their top operating constraint. Plywood prices move fast when log inventories tighten. There’s no buffer left to absorb a bad cutting season or a mill outage.
Tariffs are reshaping landed costs. U.S. tariff increases on Canadian lumber have already cut import volumes into North America, tightening domestic wood-products supply and pushing up production costs at the mill level. Trade duties on imported panel products compound this: every layer of friction adds a line item that shows up in your quote.
Ocean freight is a direct, separate cost lever. Higher container rates, vessel charges, and port fees raise landed plywood prices even when the ex-factory number hasn’t budged. Market commentary is explicit: firm North America plywood pricing is tied directly to tight supply plus rising ocean freight, two forces that stack on top of each other.
Adhesive, resin, and energy inflation round out the picture. Formaldehyde-based adhesive costs track natural gas prices closely, so every energy price swing eventually shows up in your plywood invoice. Labor shortages limit domestic production capacity, and these input costs keep structural panel supply tight exactly when demand—driven by construction, renovation, and furniture manufacturing, cited by 68% of industry participants as the primary volume driver—refuses to cool off.
Add low current inventory levels into that mix, and small demand shifts get amplified into outsized spot-price moves. That’s the mechanic behind the volatility you’re seeing in September’s numbers.
Q3 2026–Q2 2027 Plywood Price Forecast Scenarios
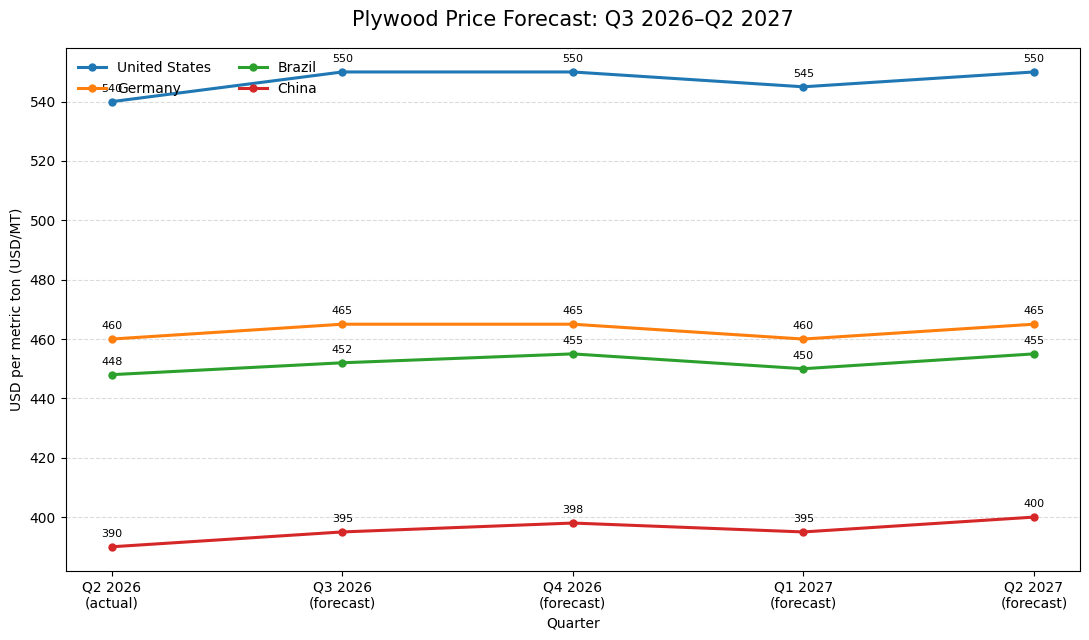
Three forecasting shops ran the numbers. They came up with three different ranges, but one shared conclusion: plywood prices are going up. Just not in a straight line. Here’s how to read the range.
Base case: +2% to +5% through Q2 2027. S&P Global Market Intelligence’s Q3 2026 forecast puts full-year plywood prices up 3.9% for 2026. A separate forest-products outlook splits the timeline further — softwood market prices up 3.1% in 2026, accelerating to 7.7% in 2027 as demand growth finally outpaces supply growth. ERA Forest Products Research backs the trajectory from a different angle: lower import volumes plus stable demand push North American structural plywood prices up marginally in both years. The common driver across all three is tariff-related import tightening, not a demand boom.
The Brazil variable matters more than most buyers realize. Brazil has supplied roughly half of all offshore plywood imports over the past three years. New 50% tariffs on Brazilian shipments are forecast to sharply cut that volume starting in this window. Less offshore supply, same U.S. demand, upward price pressure — that’s the mechanism behind the base case.
Bear case: weak end-market demand combined with the persistent OSB discount keeps plywood gains near zero. Prices stay range-bound through the full period. Fastmarkets flags this explicitly, citing “limited upside” for plywood specifically because OSB remains cheap enough to pull specifiers away.
Bull case: if demand acceleration outpaces expectations while Brazilian import volumes drop faster than modeled, pricing could climb into mid-to-high single digits by 2027 — consistent with the broader softwood upside already forecast for that year.
Procurement Timing Framework: Three Leading Indicators for “Buy Now or Wait”
Forget waiting for a headline that says “prices are rising.” By the time that hits your feed, the window’s already closing. You need a framework that tells you before the price moves, not after.
Indicator 1: Supplier delivery times. This is your earliest warning. ISM’s Supplier Delivery Times Index showed the sharpest lengthening since August 2022 back in April 2026, and lengthening lead times consistently precede price increases. Ask your mill or distributor for quoted lead time on your next order, then compare it to last month’s. If it’s stretching, the market is tightening before the invoice reflects it.
Indicator 2: Price momentum across spot, forward, and indexed costs. One data point doesn’t confirm a trend. Track spot price, 3-month forward price, and the PPI reading together. If all three point the same direction, that’s your signal, not just one number in isolation.
Indicator 3: Demand-supply mismatch. When demand outpaces available supply, lead times rise and price cuts stop happening. When supply eases, the opposite occurs. Watch mill capacity announcements and housing starts together as your proxy for this mismatch.
Buy now when at least two of three are worsening — lead times stretching, prices trending up, and the material is operationally critical. Wait when lead times are stable, prices are easing, and the order isn’t urgent.
Track quoted lead time, delivery-time index, spot price, 3-month forward price, mill capacity announcements, and housing starts data each week. Five minutes a week beats guessing every quarter.
U.S. Plywood Supply Outlook by Product, Source and Region
Odds are your plywood came from Vietnam, Cambodia, or Canada. That distinction is about to matter more than ever for your sourcing plan, so check our North America wood panel price guide for country-by-country cost comparisons.
Import concentration is narrow. Under HTS 4412, Canada leads at 17.3% of import value, with Cambodia and Vietnam tied at 11.9% each, then Brazil (10.6%), Indonesia (8.9%), Malaysia (8.6%), and Chile (8.4%). Six countries control roughly two-thirds of U.S. plywood imports.
Hardwood plywood is even more concentrated. Total 2024 imports hit 5.0 million m³, with Vietnam (980K m³, +33%) and Indonesia (891K m³, +40%) alone accounting for 30% and 28% of volume in 2025. Finland (+186%) and Italy (+112%) are smaller but surging.
Product mix: birch plywood dominates at 1.71 million m³, ahead of non-tropical hardwood plywood (1.17 million m³) and tropical plywood (332K m³).
Duty exposure is shifting supply. Vietnam and Indonesia face antidumping/countervailing duties, and Russia has already gained share as those two lost ground in the June quarter.
Domestic production clusters in two regions: the South (Texas to Kentucky/Virginia, 4.92 million MSF capacity, 35.8% market share) and the West (Oregon, Washington, Idaho, Montana, 25.5% share). Most imports enter through East and South ports — congestion there hits your supply chain first.
OSB vs. Plywood Prices and Construction Material Substitution
A 4×8 sheet of 7/16″ OSB runs $9–$20. A 1/2″ CDX plywood sheet costs $18–$52. That’s a 50% to 160% premium for plywood over comparable OSB sheathing.
A July 2026 contractor pricing survey nails the concrete spread — OSB at $14–$20, plywood at $28–$52, a gap of $14–$32 per sheet. Regionally it holds steady: Southeast ($14–$18 vs. $32–$42), Texas ($15–$19 vs. $35–$45), Midwest ($15.50–$19 vs. $36–$46).
Under PS 2 structural panel qualification, OSB and plywood with matching span ratings and exposure classifications are interchangeable. Builders switching to OSB save $3–$5 per sheet on lower-thickness sheathing, and whole-house savings can reach $2,000–$2,500 by using OSB throughout.
Where moisture exposure, fastener holding, or finish-grade requirements matter, plywood is the choice, such as film-faced plywood for concrete formwork. Premium AC sanded plywood ($55–$85) and pressure-treated plywood ($75–$120) are spec-driven necessities, not optional upgrades.
Role-Based Actions for Contractors, Procurement Managers and Investors
Same market data, three different playbooks. Here’s what to actually do with it.
Contractors: Lock quotes now if you’re bidding single-family framing jobs. Softwood plywood is 82.1% above pre-COVID levels and still climbing. Build spec flexibility into your RFQs so OSB substitution stays on the table where PS 2 ratings allow. Push suppliers weekly on quoted lead times. That’s your earliest tell.
Procurement managers: Run the three-indicator framework against your live PO pipeline before renewing contracts. Diversify beyond Vietnam and Indonesia because of AD/CVD exposure. Russia is already gaining share for a reason. Negotiate payment terms now, before Brazilian tariff pass-through hits landed cost.
Investors: Treat mill capacity announcements and housing permit data as leading risk signals. Weak multifamily permits (-3.1%) plus tight log supply (22% of manufacturers flagging it) mean margin pressure is structural. Price it into valuation models.
Verifiable Data Sources for the U.S. Plywood Market Forecast
A forecast needs numbers with a paper trail.
Build your model on APA – The Engineered Wood Association’s Quarterly Production Report for mill output, imports, exports, and Canada trade flow.
Cross-check volume against UNECE’s Forest Products Annual Market Review, which shows U.S. softwood plywood production hit 7.006 million m³ in 2023, down 0.97% year-over-year, with 2024 expected to hold near that level.
Track BLS PPI NAICS 3212 for price trends; it read 190.577 in August 2026.
Size the industry with IBISWorld’s NAICS 321212/321211 data, which reports $44.9B revenue and 2.14% growth. Stress-test against IMARC, Grand View Research, and MarketsandMarkets, whose CAGR estimates range from -1.9% to 5.44%.
Conclusion
Softwood plywood pricing is holding in a tighter band than last winter’s swings. But log costs, mill capacity shifts, and tariff exposure mean the Q3 2026–Q2 2027 window won’t move in a straight line. If you’re bidding jobs, the housing starts data and OSB vs plywood price gap are your early-warning signals. Don’t wait for the invoice to tell you what the futures market already knows. Procurement managers should track mill announcements weekly. Investors should watch capacity utilization as closely as price per thousand square feet. Buyers evaluating new supply partners can also review a manufacturer’s wood panel production lineup for context.
The decision framework and sourced data here won’t update themselves, though. Bookmark the USDA and NAHB feeds we’ve referenced, run your own numbers against the three leading indicators, and revisit your buy/wait call monthly. The contractors and buyers who win built their own dashboard first. To learn more about BAIER’s manufacturing background, visit our About Us page.