
Chile’s radiata pine forests power one of South America’s most concentrated plywood supply chains—and that concentration cuts both ways for procurement teams betting on stable pricing. A handful of major producers control the bulk of Chile’s wood products export volume, which means supply shocks ripple fast, but it also means the market is easier to read once you know where to look. At the same time, Chile’s construction industry is entering a growth phase that will test whether radiata pine plywood supply can keep pace with residential and infrastructure demand through 2030.
This report breaks down the raw material sourcing behind Chile radiata pine plywood, maps who’s producing and exporting it, and translates construction-sector growth data into real demand signals. If you’re negotiating supply contracts, managing inventory risk, or forecasting plywood price movements in this market, the numbers ahead will change how you plan your next 12-24 months.
Chile Plywood Supply Chain Structure: Raw Materials & Key Producers
Two numbers tell you everything about who controls Chile’s plywood supply: 75% and 72%. Radiata pine makes up over 75% of Chile’s total plantation area, making it the default feedstock for nearly every plywood mill in the country. And when it comes to exports, Arauco and CMPC alone control 72% of the radiata pine export market. Some industry sources put combined plantation ownership between these two firms as high as 70%; others cite the top three companies at roughly 40%. Either way, the pattern holds: log supply flows through a small number of vertically integrated groups.
These companies control logs, sawnwood, veneer, and plywood production end-to-end. That gives them pricing power and first claim on supply. Smaller buyers get tighter allocations when demand spikes, with less room to negotiate.
Supply volume isn’t the bottleneck here. UNECE data forecasts annual radiata pine harvest growth from a baseline of 18.8 million m³, backed by mature plantation inventories. The real constraint is access to large-diameter sawlogs, which major mills prioritize for their own plywood lines.
Export Market Concentration
Plywood represents about 10% of Chile’s panel output, compared to 50% particleboard and 35% fibreboard. But within that segment, export data from 4M-2025 shows just how concentrated it is. Total plywood exports hit USD 131.4 million, up 2.6% year-on-year. Paneles Arauco led with USD 63.7 million (48.5% share), CMPC Maderas followed at USD 40.7 million (31.0% share, up 17% YoY), and Eagon Lautaro brought in USD 15.6 million (11.9% share, up 20% YoY). Together, these three producers captured 91.4% of total export value.
Arauco’s flagship product, AraucoPly, is phenolic-resin radiata pine plywood built to international specs. It ships to the US, Canada, Mexico, Colombia, and Costa Rica, so demand is diversified rather than tied to a single market.
For procurement teams, framework contracts and direct mill relationships matter more than spot buying when export demand tightens.
Chile Plywood Export Market: Suppliers, Destinations and Trade Dependencies
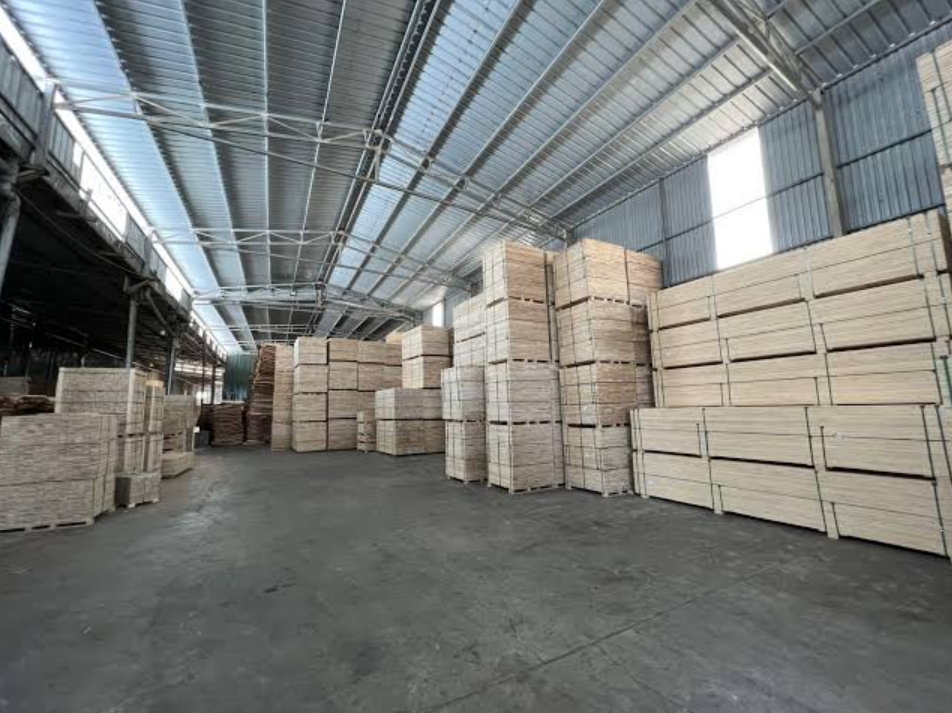
One country buys more than half of Chile’s plywood exports. In 2022, Chile shipped USD 567 million in plywood worldwide, ranking 8th and landing as the country’s 25th most-exported product. Here’s where that volume went.
Top 5 destinations in 2022:
– United States: USD 280M
– Mexico: USD 56.4M
– Netherlands: USD 38.7M
– New Zealand: USD 29.4M
– Australia: USD 25.6M
The US alone absorbed 49.4% of total plywood export value that year. Add the next four markets and you hit 75.2% of all exports concentrated in just five destinations. That’s a narrow base for a global commodity.
Fast forward to 2025, and the pattern has tightened, not loosened. The US bought USD 70.96 million of Chile’s plywood in the first four months alone, pushing its share to roughly 54% of total export value. That’s higher concentration than in 2022.
Chile’s plywood sector rides on US construction cycles, tariff policy, and shipping logistics almost more than domestic demand fundamentals.
Zoom out to forestry. Chile’s forestry exports hit USD 2,663.4 million FOB in Jan-May 2025, according to Chile forestry export statistics, up 8.8% YoY. Chemical pulp drove that growth, capturing 55.7% of value (USD 1,484M, up 14.9%). Wood boards came in second at USD 257.8M, just 9.7% of the total. Plywood matters, but pulp is the sector’s real growth engine. At the country level, China and the US together account for 55.3% of all Chilean forestry exports, reinforcing the same concentration risk buyers see in plywood.
Import Reliance & Supply Diversification: China, Brazil and Beyond
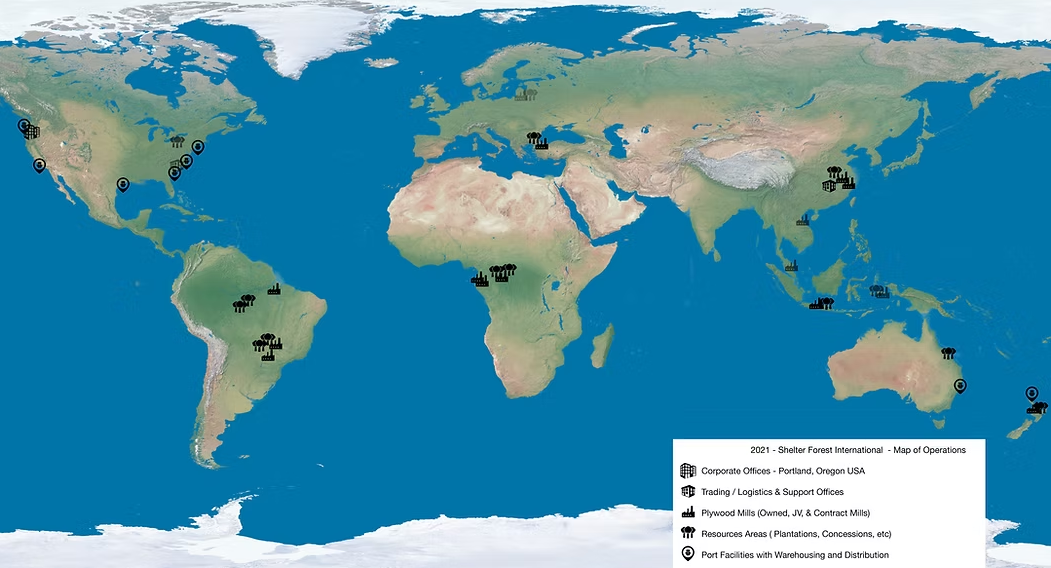
Chile imports a narrow slice of plywood, and where that slice comes from is more concentrated than you might expect. In 2023, the country brought in roughly USD 20.1 million of non-coniferous surface plywood (HS 4412.12). China shipped USD 16.83 million—83.8% of the total. Paraguay added USD 1.85 million (9.2%), Uruguay USD 0.32 million (1.6%). Together they cover 94.6% of this category. Estonia, Canada, a few small EU suppliers—everyone else splits the remaining 5.4%.
Buyers evaluating alternative origins should also understand how the plywood supply chain affects lead times, landed cost, inventory risk, and supplier diversification.
The same pattern shows up across all plywood imports. OEC trade data for 2022 puts China at USD 22.7 million, Brazil at USD 7.52 million, Uruguay at USD 7.16 million, Paraguay at USD 3.93 million, and Germany at USD 0.57 million. Each supplier plays a different role. China handles volume and price. Brazil, Uruguay, and Paraguay fill regional gaps. Germany covers high-spec or small-batch orders—certification-heavy, tight-tolerance jobs that local mills can’t reliably match on surface grade or bonding strength.
What This Means for Procurement
A practical sourcing split looks like this:
- 70-80% primary supply from China
- 15-25% regional backup from Brazil, Uruguay, or Paraguay
- 5-10% specialty sourcing from Germany or other EU suppliers
Chile’s trade surplus hit USD 1.449 billion in October 2024 alone, with exports at USD 8.588 billion against imports of USD 7.726 billion. That signals stable currency and payment conditions, not raw material abundance. This is the time to lock annual framework contracts with your China supplier while running monthly backup pools through Brazil and Paraguay to hedge against exchange-rate shifts and single-mill disruptions.
Chile Construction Market Growth Trajectory: 2025-2030 Forecast
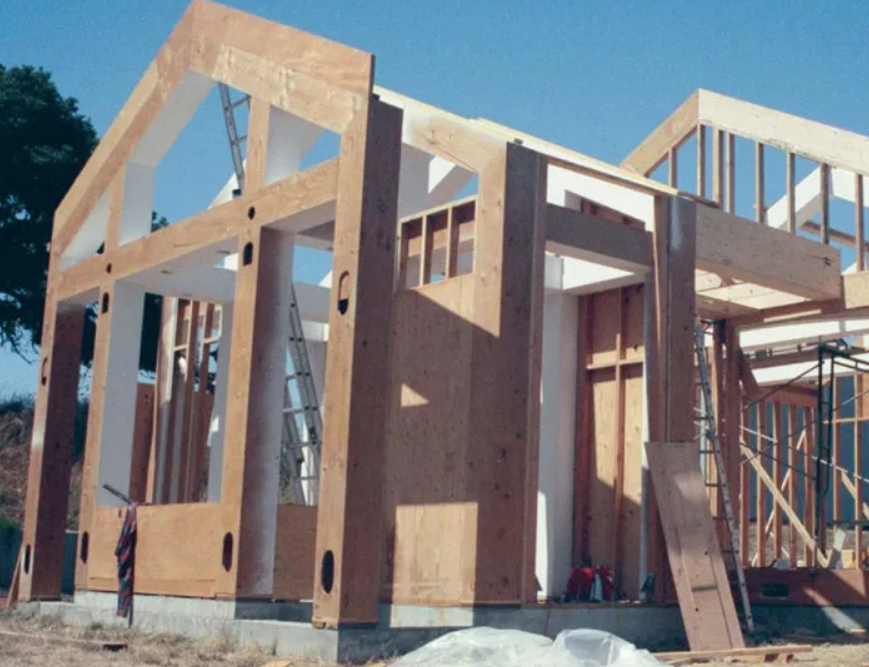
Two forecasts, two different stories. Both matter if you’re planning plywood inventory through 2030. The base case puts Chile’s construction market at CLP 16.56T in 2025, climbing 3.9% to CLP 17.21T in 2026, then reaching CLP 20.23T by 2030. That’s a 3.2% CAGR for 2026-2030, following a stronger 5.7% CAGR from 2021-2025. A separate industry forecast is more bullish, with 3.7% real growth in 2026 and a 4.6% average for 2027-2030. The gap comes down to methodology. The lower figure tracks value in CLP; the higher one measures real output, assuming heavier support from transport, mining, housing, institutional builds, and energy-transition projects.
These construction forecasts can be compared with official Chile construction industry statistics covering building activity, investment, and construction-sector indicators.
Where Growth Is and Isn’t
The headline numbers hide a split market. Productive infrastructure is forecast to surge 15.5%, driven almost entirely by mining and energy investment. Public infrastructure goes the other direction, falling 10.1%. The rebound is concentrated in private, productive projects.
Housing tells a similar two-track story. Public housing investment is projected to rise 8.7% in 2026, but private housing contracts 2.8% over the same period. Public support cushions the sector; it doesn’t reverse the slowdown.
What This Means for Plywood Demand
Structural plywood should track the productive infrastructure curve more closely, benefiting earlier as mining and energy projects ramp up formwork and temporary-works demand. Decorative plywood, tied to housing completions, fit-outs, and institutional interiors, will likely lag until private housing stabilizes and institutional delivery volumes pick up later in the forecast window.
For procurement planning, that timing gap matters. Stock structural-grade radiata pine plywood ahead of the infrastructure wave; hold decorative-grade orders closer to actual housing completion data before committing to volume.
Plywood Market Value Projection: Demand Drivers & Growth Rate
Chile’s plywood market is small in absolute terms, but the trajectory tells you where to focus. Market value sits at USD 0.65 million in 2025 and is projected to reach USD 0.79 million by 2030, a 4.03% CAGR. That’s slightly below the global plywood market’s 4.88% CAGR over the same window, so Chile grows, just not as the fastest mover on the board.
Two forces drive that number. Construction leads, absorbing structural and non-structural panels across housing, remodeling, flooring, roofing, and formwork—the same infrastructure and housing dynamics covered earlier in this report. furniture and manufacturing output form the second pillar, providing steadier baseline demand tied to factory cycles rather than housing swings. Construction offers more upside; furniture offers more stability.
Price Pass-Through From Raw Material to Sheet
Radiata pine input costs move independently of end-market demand, and that gap matters for margin planning. Chile timber pricing shows radiata pine KD at USD 245/m³ FOB San Antonio for 2026. When log prices rise, panel producers typically pass part of that increase into sheet pricing, but with a lag, not instantly.
Sheet-level pricing already reflects wide segmentation. Export listings show US$4.00-6.00 per sheet at 800-2,000+ sheet MOQ, while a separate retail channel prices radiata pine plywood at US$75 per 4×8 sheet. Bulk triplay pine plywood runs US$3.80-4.00 at 1,000 m³ MOQ, and tongue-and-groove variants range US$7-13 to US$14.59-14.66 depending on thickness and spec.
For buyers, construction slowdowns compress value growth even when volume holds steady, because raw material costs keep climbing regardless of demand pace.
Key Risk Factors: Supply Concentration vs Demand Cyclicality
Two numbers explain most of the risk in this supply chain: 33.1% and 4.6%. The first is the US share of Chile’s softwood plywood imports in 2024, up from 32.7% in 2023—Chile has held the top import spot in the US for two straight years, worth USD 245 million CIF. The second is October 2025’s month-over-month drop in US housing starts. When one buyer controls a third of your export value and that buyer’s housing market wobbles, the exposure compounds fast.
Why the US Concentration Cuts Both Ways
Ranking the top five destinations by export value—US, Mexico, Netherlands, New Zealand, Australia—totals USD 598 million. The US alone accounts for 46.8% of that combined figure. That’s dependency dressed up as market leadership.
Demand-Side Cracks in the US Housing Market
Single-family starts rose 5.4% month-over-month in October 2025 but still sit down 7.0% year-to-date. Private residential construction fell 1.3% year-on-year. US construction spending hit USD 2.18 trillion annualized, up 0.5% monthly, down 1.0% year-on-year. Structural and formwork plywood tied to single-family builds absorbs this cyclicality first and hardest.
Tariffs, Freight, and FX: The Cost Triangle
New US tariffs hit USD 1.18 billion in Chilean timber shipments, with 97% of Chile’s forestry exports to the US affected. Layer in ocean freight swings and peso depreciation, and landed costs move on three fronts simultaneously—tariffs, shipping, currency—each capable of eroding margin independently, all three capable of hitting at once.
12-24 Month Market Outlook: Base Case, Upside and Downside Scenarios
By 2026, the market lands on one of three numbers: 1.34 million, 1.50 million, or zero. Each corresponds to a US housing starts scenario and a different outlook for Chile radiata pine plywood demand.
Base case: US housing starts settle around 1.33-1.36 million units in 2026, roughly flat to -1.0% versus 2025. Residential demand alone drives 52% of global plywood consumption, so this range points to low single-digit growth. North American wood products demand backs this up: domestic consumption rises just 0.4%, but factory-level demand (domestic plus exports minus imports) reaches 2.0%. Export volume does the heavy lifting. Tariff-driven supply is shifting toward the Middle East, India, and the EU, creating a structural price floor that keeps pricing firm even without strong volume growth.
Upside scenario: housing starts climb toward 1.50 million, an 8-9% jump. This is a low-probability, high-impact case triggered by rate cuts or credit easing. It would push plywood demand into mid-to-high single digits, with structural and formwork grades reacting fastest.
Downside scenario: starts stall near 1.33 million, single-family builds stay weak, remodeling spend drops, and export concentration tightens further. The net result is near-zero demand growth with sharper regional price swings.
Strategic Procurement Recommendations for Chile Plywood Sourcing
Lock your supplier mix before you lock your price. That’s the practical starting point.
Supplier allocation: Anchor 60-70% of your volume with Chilean mills (Paneles Arauco, CMPC Maderas), 15-25% through Asian sourcing, and 10-20% via Brazil or Uruguay. Push Chile’s share to 70-80% if your project needs tighter compliance and delivery certainty.
Contract terms to negotiate: 12-month framework agreements covering 70-80% of annual need, with quarterly price re-openers, take-or-pay minimums, delivery SLAs, a 7-14 day post-arrival quality claim window, and a pre-approved alternate spec list.
Inventory buffers: Hold 6-8 weeks of safety stock on standard specs; extend to 8-10 weeks if one supplier exceeds 35% of your volume. For US-linked orders, run two-tier stock—port-in-transit plus warehouse.
Early-warning triggers: Two consecutive months where order value drops over 5%, monthly Chilean forestry export data falling more than 10% below the six-month average, or any single major mill’s monthly export volume dropping over 15% year-on-year—each should trigger a supply review or backup activation.
Conclusion
Chile’s plywood story has three hard truths. Supply is concentrated in a handful of radiata pine producers. Construction demand is climbing steadily through 2030. That combination leaves buyers exposed to price swings whenever export bottlenecks or currency shifts hit. The Chile plywood supply chain is tight enough that reactive sourcing will cost you.
Build redundancy now by diversifying supplier relationships beyond the top exporters, locking in longer contracts before the next construction upcycle tightens margins, and tracking the Chile construction industry trends we’ve outlined here as leading indicators for your inventory decisions.
Don’t wait for a supply shock to test your backup plan. Start mapping alternative sourcing channels this quarter, and revisit your procurement strategy against our 12-24 month outlook before Q3 pricing pressure sets in. The buyers who move early will set the terms; everyone else will pay them.