
When you’re looking at a plywood supplier quote, the real decision is whether to buy now or wait. Guess wrong on a few truckloads of plywood, and the margin you promised your customer disappears. This plywood price forecast outlines where prices are headed over the next 3, 6, and 12 months, along with the evidence behind each call. We break down what’s moving the market, from log costs and housing demand to tariffs, freight, and mill capacity, then compare softwood, hardwood, birch, and marine grades across major origins. You’ll also see how distributors, manufacturers, and contractors can time purchases, when OSB becomes the smarter swap, and which plywood price index signals you can track on your own.
Plywood Price Forecast for the Next 3, 6, and 12 Months: Up, Flat, or Down?

U.S. softwood plywood prices should edge higher over the next quarter, level off through midyear, and then drift lower. That is our base case for the benchmark domestic market. Buyers sourcing from China, Southeast Asia, or other regions will need to factor in local timber, glue, shipping, and currency shifts.
|
Window |
Call |
Expected move |
Main reason |
|---|---|---|---|
|
3 months |
Firm, then flattening |
0% to +5% |
Tight spot availability, import tariffs, and high raw material costs support pricing, while off-season demand curbs larger gains. |
|
6 months |
High plateau to slight dip |
-3% to +3% |
Supply conditions ease while demand recovers slowly. North American outlooks point to “stable to softer” conditions. |
|
12 months |
Flat to weaker |
-5% to +3% |
Housing starts will likely drop by mid-single digits in 2027. Incoming mill capacity adds pressure, though tariffs help buffer domestic mills. |
What the data says
Boise Cascade reported a Q3 2026 plywood net selling price of $425 per thousand square feet, up 31% year over year and 8% over the previous quarter.
Over that same stretch, total U.S. housing starts slipped 4%, with single-family construction down 2%.
S&P Global projects plywood prices to climb roughly 3.9% across 2026, with the spot rally fading in Q4.
Costs for veneer logs, adhesives, fuel, and labor have risen 5%–30%, running about 10% higher on average.
Fastmarkets expects lower import volumes to support domestic producers, but OSB still trades at a steep discount, checking plywood’s upside.
One pricing model projects sheets will slide from 368 cents per sheet in 2026 to 365 in 2027 and 358 in 2028 as markets shift toward oversupply.
Three scenarios
Base case (45%–50%): Modest gains early, a flat plateau after six months, and a mild dip by month 12.
Upside (25%–30%): Housing starts hold steady, tariffs push import costs higher, or mills curb output. Prices could surge 5%–10% within three months and stay there.
Downside (20%–25%): Home construction slows, OSB captures more market share, and new capacity arrives. Prices could fall 5%–12% across 6–12 months.
What this means for buying
0–3 months: Lock in 50%–70% of your volume to shield against tariff changes, freight spikes, and sudden mill increases.
3–6 months: Space out orders, locking in 20%–30% each month or quarter.
6–12 months: Cover base volume only and float the rest on the spot market.
Tariffs and elevated production costs will support prices near term, while cooling housing demand and incoming mill capacity will limit gains down the road.
Log and Fiber Costs: The Base Variable Behind Plywood Cost Increase
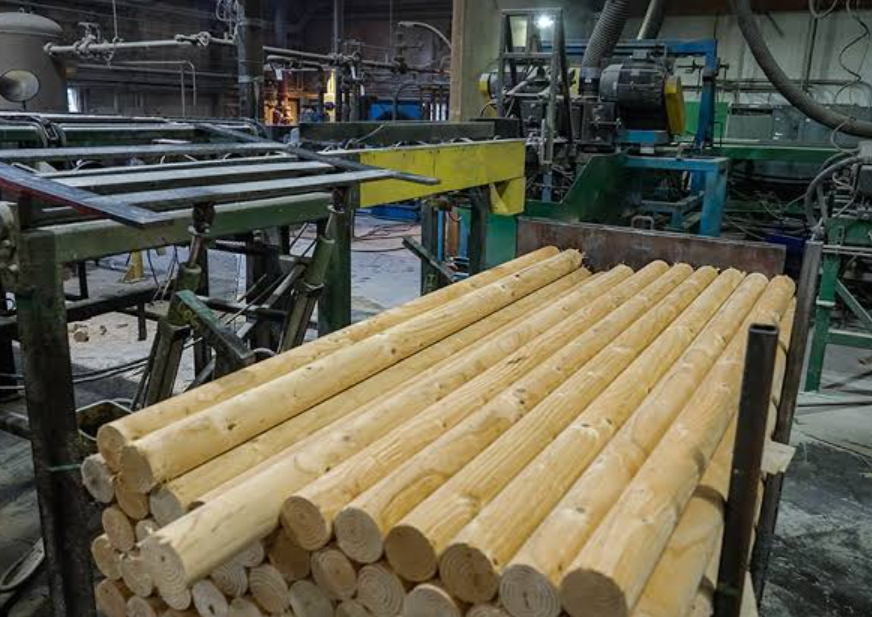
Logs and veneer make up about half of every sheet’s cost. Misread this baseline, and every quote built on top of it drifts.
Where the cost sits
Logs and veneer: 45%–65%
Adhesives: 10%–20%
Energy, labor, sanding, packaging: 15%–25%
Freight, financing, margin: 10%–20%
A 10% rise in log or veneer cost lifts plywood production cost by 4.5%–6.5%, all else equal.
Cheaper logs don’t guarantee cheaper plywood
In 2025, imported tropical logs averaged about $160/m³ CIF (down 8%), while imported softwood logs averaged about $123/m³ CIF (down 6%). Even so, finished plywood costs can climb if glue, energy, labor, or freight rates rise.
Price the veneer you can actually use
Turning logs into veneer involves steady volume loss from peeling, grading, moisture control, and discarded cores. In China, EU anti-dumping documents cite a poplar log benchmark near RMB 980.49/m³ and eucalyptus veneer near RMB 4,073.14/m³. That is roughly a fourfold jump.
Species drive pricing just as heavily. Peruvian Lupuna veneer runs $221–266/m³ FOB Callao. Treated, sanded Lupuna reaches $396–419, and Cedar fissilis hits $766–783.
Consider this scenario: logs rise 5%, yield drops 5 points, freight climbs 10%, and glue climbs 15%. Your total cost increase will blow past 5%. Base quotes directly on log delivered price ÷ usable veneer output instead of adding a flat markup to the raw log cost.
Fiber competition and the softwood–hardwood split
Pulp, particleboard, MDF, and biomass buyers all compete for the same roundwood and chips. Mills without long-term supply agreements lean on spot buying, where prices swing harder. Between January 2022 and April 2025, U.S. hardwood veneer and plywood producer prices rose about 4.5%, while softwood fell close to 29%. Always track them by species.
Track these: log delivered cost, yield by species, veneer inventory days, and the lag between log moves and plywood quotes.
Construction Starts, Remodeling, and Furniture Demand: What Drives the Plywood Price Trend

Housing drives roughly 52% of global plywood market revenue. Panel orders track starts, permits, and household formation directly.
New construction sets the pace
In North America, homebuilding accounts for two-thirds of structural panel consumption. When mortgage rates climb and housing starts slow, builders hold off on buying, cooling down prices. Once construction recovers, restocking pushes prices back up.
U.S. housing starts are forecast at 1.343 million units in 2026, a decline of about 1.0%, though a separate forecast projects a steeper 3.9% drop. Structural demand remains soft, but commercial builds and remodeling help absorb the difference. In 2025, OSB and plywood demand dipped about 0.3%, holding up better than hardwood and furniture panels.
Remodeling puts a floor under prices
Remodeling keeps plywood moving when new ground-up projects dry up. Contractors pull panels for cabinetry, wardrobes, vanities, subfloors, wall and ceiling substrates, partitions, door cores, stairs, and interior commercial fit-outs. When renovation demand stays healthy, prices resist falling.
Furniture favors thin and hardwood panels
Global demand for furniture and woodwork plywood should expand from $500 million in 2025 to $778 million by 2035. Cabinet and furniture builders pull mostly birch, poplar, hardwood, and laminated decorative sheets. In contrast, residential housing starts drive consumption of softwood structural and concrete-forming panels.
Regional signals
China: Mills exported close to 10 million m³ in 2025, with the Philippines, UAE, UK, and Nigeria taking nearly 2 million m³ during the second half of the year. Channeling panels into export markets can tighten local spot supply even during a domestic housing slump.
Europe: Construction across the EU should grow 1.5% in 2026, with Germany and Spain projected near 2.5%. Building permits gained 26% by September 2025. Because permits lead plywood purchases by several months, this points to stronger future orders.
Global: Softwood veneer and plywood revenue is forecast to grow from $7.1 billion to $7.5 billion in 2026. Residential construction accounted for roughly $3.86 billion in 2025 and should expand at a 4.2% CAGR through 2035.
Demand indicators to track
Housing starts, permits, and construction area
Completions and fit-out deliveries
Cabinet, wardrobe, and custom furniture orders
Distributor inventory turnover days
Inquiry volume for film-faced, hardwood, and furniture-grade panels
Chinese export orders by destination
Bottom line: Weak new builds paired with steady remodeling, commercial work, and export demand point to sideways pricing. If all three weaken together, inventories will back up and prices will fall fast.
Tariffs, Trade Policy, and Origin: The Biggest Wildcard in Imported Plywood Wholesale Price

Same panel. Same factory. Same quote. Change the country of origin, and the duty can jump from 0% to more than 100%. Origin can erase a supplier’s price edge overnight.
Duties stack, they don’t replace each other
U.S. import duties accumulate in layers:
Base HTS rate: Plywood under HTS 4412 ranges from duty-free to about 8%. Some softwood plywood carries 5.1%.
Extra duties: Section 301 and Section 232 tariffs may apply on top.
AD/CVD: Anti-dumping and countervailing duties often exceed all other costs combined.
Trade agreements change the math. USMCA-qualifying Mexican plywood enters at 0%. If paperwork fails to qualify, the rate can jump to 18%.
Hardwood and decorative plywood face the sharpest risk
In the 2025 U.S. Commerce Department investigation, alleged dumping margins reached 504.07% for China, 84.94% for Indonesia, and 138.04%–152.41% for Vietnam. Even before rates are finalized, these preliminary figures dictate supplier quotes, cash deposits, and purchasing decisions.
Final cash deposit examples show the gap versus base tariffs:
|
Origin (country-wide example) |
Anti-dumping |
Countervailing |
|---|---|---|
|
China |
185.96% |
88.96% |
|
Vietnam |
84.95% |
47.68% |
|
Indonesia |
18.06% |
40.87% |
Individual producers may qualify for separate company-specific rates, which changes both unit pricing and working capital requirements.
Quick math: On a $100,000 shipment, every extra 10 points of duty costs $10,000. At 185.96% plus 88.96%, the cash deposit reaches $274,920, well beyond the value of the cargo itself.
Don’t trust the ship-from port
Customs determines origin by where components are transformed, regardless of where the container was loaded. If a third-country mill assembles Chinese veneer, core stock, or semi-finished panels, U.S. Customs can apply substantial transformation rules and reassign origin back to China. Importers face back duties, financial penalties, seized shipments, and retroactive AD/CVD assessments.
Require suppliers to provide:
Origin declaration and timber source
Production location of each panel layer
Process records
Proof that packing lists and commercial invoices match
Compare quotes on landed cost
FOB and CIF numbers leave out the most volatile expenses. Calculate total liability before ordering:
Landed cost = cargo value + freight and insurance + base duty + Section 301/232 duties + AD/CVD deposit + port and customs fees
Customs assesses AD/CVD on declared customs value, and retroactive administrative reviews can raise final rates after delivery. A quote that pencils out today can easily incur added liabilities later.
Put tax risk in the contract
Spell out:
HTS code and product description
Country of origin and named producer/exporter
Who pays duties, AD/CVD, inspection fees, and retroactive assessments
A price adjustment trigger for policy changes
Compensation and replacement supply if origin or rate is wrong
The producer documents needed for an individual rate
Tier your suppliers
Low risk: Valid trade-agreement eligibility and complete origin evidence.
Medium risk: Standard MFN rates, no clear AD/CVD measure, but disputed classification.
High risk: Chinese, Vietnamese, or Indonesian hardwood and decorative plywood, particularly mills lacking company-specific rates or clear chain-of-custody timber logs.
Ocean Freight, Exchange Rates, and Landed Cost: Why an FOB Quote Isn’t the Final Price
On October 29, 2026, a 40-foot container from Shanghai to New York cost about $9,631. The same box to Los Angeles ran about $7,514. That gap alone can reorder your supplier ranking.
What FOB actually covers
FOB ends when cargo is loaded on your named vessel. Ocean freight, transit risk, and every later charge move to you. Asia to the U.S. West Coast ran $7,580–8,300 per 40-foot container, versus $9,700–11,500 to the East Coast. These figures cover spot ocean rates alone.
Common add-ons
Insurance: about 0.35% of cargo value
ISF filing: $25–50 per entry
Customs brokerage: $150–300 per entry
Destination handling and delivery: $200–800
Example: A container of 6,000 units with a $60,000 FOB value lands at about $94,116. That comes to $15.69 per unit against a $10 FOB price, leaving a gap of $5.69.
Exchange rates widen the gap
Say a supplier quotes RMB 720,000 and the rate moves from 7.20 to 6.90. Your cost rises from $100,000 to about $104,348, an extra $4,348 with no change in the factory price. For every container, track the FOB settlement, booking, customs, and booking-entry rates on their own.
Make quotes comparable
Match these points before evaluating options:
Origin and destination ports
Container type (20GP, 40GP, 40HQ)
Surcharges included in freight (fuel, peak season, war risk, congestion)
Quote validity and currency basis
Duty rate and HS code
Port fees, clearance, and inland delivery
Cost allocation by container, cubic meter, or unit
Bottom line: Base your choices on landed cost per unit. Bulky, low-value panels get hit hardest by freight and port fees. Check how FOB, CIF, and DDP terms shift these costs between you and a building materials supplier.
Mill Capacity, Downtime, and Inventory: What Drives Short-Term Plywood Price Fluctuation
A single maintenance outage can move spot plywood faster than a year of capacity data. Buyers pay for panels shipping this month, regardless of what a mill could produce on paper.
Capacity cuts set the floor
Metsä Group plans to close its Suolahti plywood mill in Finland in phases. That removes about 160,000 m³ a year of spruce plywood by the end of 2026.
Roseburg stopped hardwood plywood production at its Dillard, Oregon, plant in September 2025.
Low-cost imports hold about 80% of the U.S. hardwood plywood market, according to Roseburg. A domestic exit will not trigger an outright shortage, but it leaves buyers exposed on specific grades, dimensions, and lead times.
Downtime beats annual capacity
West Fraser reported plywood output of 182, 172, and 176 million sq ft (3/8″ basis) across recent periods, with several mills running annual maintenance outages during the quarter. Management noted that production climbed year over year once planned downtime dropped. Scheduled outages directly dictate what actually ships.
Watch weeks down per mill, restart dates, and order backlogs rather than static nameplate ratings.
High operating rates do not guarantee ready inventory either. U.S. softwood mills ran hard in 2026, yet spot material stayed scarce. Veneer peeling bottlenecks and higher adhesive costs drove up quote floors. By September, U.S. plywood prices reached about $555 per ton as builders and industrial panel processors competed for spot orders that domestic mills struggled to fill.
Inventory turns supply risk into price swings
Boise Cascade saw July–September 2026 plywood volumes fall 7% even while prices climbed, pointing to supply friction from Canadian and Brazilian trade policy. The U.S. also introduced a 50% tariff on Canadian veneer, plywood, and LVL in August 2026, which altered Western supply patterns and made import shipments erratic.
Read the inventory signals
Strongest tightness signal: Distributor inventory falls while spot prices rise.
Early warning: Supplier backlogs grow and lead times stretch. These shifts usually surface before published indexes move.
Bigger swings: Mill downtime and import delays hit together.
Weak rally: Inventory builds while order files shrink. Boise Cascade projects only a minor sequential price gain in Q4 because of this pattern.
Short-term price framework
|
Outlook |
What you’d see |
|---|---|
|
Higher odds of increases |
Capacity cuts or planned downtime, restricted imports, falling distributor stock |
|
Stable |
Steady domestic output, smooth import flow, enough inventory to cover near-term orders |
|
Higher odds of declines |
Mills back online, backlogs shrinking, distributor stock rebuilding |
Monitoring rhythm
Weekly: mill downtime notices, rail and port delays, distributor days of supply
Monthly: production volumes, import arrivals, distributor inventory and order counts
Trigger rule: If inventory drops and quotes rise for two straight weeks, lock in your fast-moving specs early. If inventory climbs and orders fade, do not overstock.
Plywood Price Comparison by Grade and Origin
The same 18mm panel can quote at $380/m³ or $720/m³. That price gap comes down to origin, wood species, glue, and surface finish. Use the figures below as reference points for your market analysis.
Export reference prices by origin (2026, per m³)
|
Origin / grade |
Price range |
Notes |
|---|---|---|
|
India, commercial plywood |
$380–440 (avg ~$408) |
Lowest-priced Asian option |
|
Indonesia, commercial plywood |
$420–480 (avg ~$455) |
Tropical hardwood face |
|
Brazil, pine plywood |
~$430 |
Structural and packaging use |
|
Vietnam, film-faced |
$460–520 (avg ~$505) |
Formwork and furniture |
|
China, film-faced formwork |
$480–550 (avg ~$525) |
Standard 18mm, 1220×2440mm, phenolic film, WBP glue |
|
Malaysia, tropical hardwood |
~$540 |
Tropical species |
|
Russia, birch |
~$580 |
Above Chinese and Southeast Asian commercial boards |
|
Baltic/European birch |
$650–720 (avg ~$695) |
Furniture, cabinets, load-bearing |
Public quotes from wood panel suppliers for standard Chinese export plywood range from $220–650/m³. The wood species, core build, glue grade, and surface finish account for the spread.
2024 declared export averages
Customs-declared averages show where the top and bottom of the market sit:
Finland, birch: ~$1,369/m³
Latvia, birch: ~$1,167/m³
Indonesia, tropical species: ~$603/m³
Malaysia, tropical species: ~$471/m³
China, non-coniferous face (HS 4412.33): ~$396/m³. High-volume export boards hold a clear price advantage.
Price per 4×8 sheet (~1220×2440mm)
|
Grade |
Price per sheet |
|---|---|
|
CDX / standard softwood |
$35–65 |
|
Sanded pine |
$45–80 |
|
Birch/maple furniture grade |
$55–110 |
|
Baltic birch |
$70–140+ |
|
Marine plywood |
$80–200+ |
|
Prefinished plywood |
$90–160 |
|
High-grade hardwood face |
$90–180+ |
Typical factory quotes and MOQs
18mm standard/film-faced formwork: ~$8–18 per sheet, MOQ ~200 sheets
17mm single-side birch film-faced: ~$16–28 per sheet, MOQ ~400 sheets
Waterproof commercial plywood: ~$16.41–18.23/m², MOQ ~1,000 m²
Vietnamese mixed poplar/birch/pine/hardwood: ~$3–5 per sheet, MOQ ~100 sheets
Four price tiers
Lowest: Indian commercial panels and standard Chinese packaging or construction boards at ~$380–440/m³.
Mainstream project buying: Chinese and Vietnamese film-faced boards at ~$460–550/m³.
Mid-to-upper furniture grade: Russian and Baltic birch at ~$580–720/m³.
Premium birch: Finnish and Latvian declared export averages at $1,167–1,369/m³.
Compare like with like
Confirm these specifications before comparing any two quotes:
Thickness and sheet size
Core species along with face and back grade
Glue standard (MR, WBP, EN 314-2)
Film-faced or raw surface
Whether packing and freight are included
Mismatched terms can swing quotes by more than 100%. Ask every structural plywood manufacturer to state grade and strength values separately.
Softwood, Hardwood, Birch, and Marine Plywood Budget Benchmarks
Budget toward the middle of the price range. These North American 2026 retail and pro-lumber benchmarks reflect a standard 4×8 ft sheet (about 1.22 × 2.44 m). They exclude VAT, ocean freight, duties, cutting, and waste. Regional supply, grade, thickness, and order volume will shift your final quote.
|
Material |
Typical spec |
Planning figure (USD/sheet) |
|---|---|---|
|
Softwood plywood |
CDX, structural sheathing, 1/2–3/4″ |
45–55 for bulk jobs |
|
Softwood sanded |
Pine, utility sanded |
55–70 |
|
Standard hardwood |
Oak or maple face, cabinet grade |
70–95 |
|
Premium hardwood |
Oak, walnut, high-end veneer |
120–160 |
|
Cabinet-grade birch |
1/2–3/4″ |
70–95 |
|
Baltic birch |
5×5 ft, multi-ply, full core |
90–125 |
|
Marine plywood |
Waterproof glue, low-void core |
110–160 |
Check two things before you sign off on an order. First, confirm whether “birch” refers to a thin birch face or a full birch core. Second, never compare a 5×5 ft Baltic birch sheet directly to a 4×8 ft sheet by piece price alone.
Marine plywood needs extra headroom
A 3/4″ BS 1088 marine panel runs about $128.99 per sheet, which serves as a realistic mid-grade benchmark. Budget $160–220+ for certified or imported boards. Heavy panels, premium species, and specialty certifications push the broader market span to $85–346. For boat building or long-term wet-use installations, add a 20%–30% price contingency.
Price per square foot
A 4×8 sheet covers 32 sq ft, which translates to these square-foot rates:
Softwood: $1.09–2.03
Standard hardwood and birch: $1.72–3.44
Premium hardwood: $2.81–5.63
Marine plywood: $2.50–6.25
Quick project baselines
Structural and packaging: $50 per sheet
Cabinets, furniture, equipment housings: $85 per sheet
Visible high-end faces: $140 per sheet
Outdoor, marine, wet areas: $140 per sheet, or $200+ for certified or imported boards
Add 5%–10% over net material requirements for standard cuts and scrap. For grain matching, color selection, or small lots, plan for 10%–15%.
Index trigger for contracts
The U.S. Producer Price Index for softwood veneer and plywood sat near 267.259 (1982 = 100) in 2026 and reached about 335.765 in August. Tie a quarterly price review, or an adjustment triggered by index moves, directly into your purchase contracts.
Buyer Action Plans for Distributors, Manufacturers, and Contractors
Procurement accounts for 40%–70% of a typical contractor’s spend. Managing budgets, contracts, purchase orders, and material sign-offs under a single control system keeps projects on track. A plywood price forecast only pays off once buyers convert the data into day-to-day operating rules.
|
Role |
Core goal |
Metrics to track |
|---|---|---|
|
Distributor |
Faster turns, protected margin, less dead stock |
Inventory days, stockout rate, fill rate, gross margin |
|
Manufacturer |
Secure supply, lower cost, steady production |
Material cost share, on-time delivery, incoming quality, dual-supplier coverage |
|
Contractor |
Hold the schedule, control total cost |
Long-lead on-time arrival, site shortages, change-order value, waste rate |
Distributors
Stock by class. Maintain dynamic safety stock for A items, follow historical demand for B items, and buy C items strictly to order.
Quote with limits. Standard quotes hold for 15–30 days. Price volatile panels against monthly market indexes, and require non-refundable deposits with no-cancellation clauses on custom runs.
Hit these targets: stockouts under 2%, on-time delivery of 95% or better, and any inventory older than 180 days discounted, returned, or scrapped.
Price dynamically. Shifting off static price sheets protects against margin erosion by roughly 150–300 basis points. Pairing that with automated ordering shortens order turnaround cycles by 35%–55%.
Offer big contractors consignment inventory, direct-to-site delivery, and dedicated emergency restocking when they commit to annual volume agreements.
Manufacturers
Qualify at least two suppliers, and never award more than 60% of total volume to one vendor.
Reprice or review substitute materials whenever market rates drift 3%–5% from budget. Longer agreements work best structured around a base price plus an index adjustment, complete with agreed floors and ceilings.
Lock in explicit specs for quality standards, late-delivery penalties, MOQ, rush-order turnaround windows, and mandatory written approval before any material substitutions ship. To benchmark these terms, see how a factory-direct plywood panel manufacturer like BAIER FLOOR handles specs and batch consistency.
Score vendor OTIF (on-time, in-full) performance monthly. Dropping below 90% triggers a formal corrective action plan; hitting 95% or higher earns first look at upcoming purchase orders.
Contractors
Tie every SKU to its project, phase, drop location, and latest order date—calculated by taking required jobsite arrival and subtracting transit time, receiving inspection, and a safety buffer.
Package purchase orders by trade, building, or construction phase. Release long-lead items only after freezing submittal specs, approving physical samples, and locking in confirmed manufacturer production schedules.
Pre-approve one backup brand or spec before breaking ground.
Split contract line items into fixed labor/equipment, indexed raw materials, and separate floating allowances for freight, tariffs, and energy surcharges.
Escalate delays early: 3 days of slippage brings in the procurement manager, while 7 days triggers split orders with a backup supplier or expedited freight.
Track it monthly
Keep a clean master log tracking vendor details, active quotes, MOQ thresholds, published lead times, and purchase price history. Review three core operational metrics each month: savings rate, on-time in-full rate, and shortage stoppages. With only 7% of B2B construction purchases currently transacting online, moving to e-catalogs and digital quoting continues to give early adopters an operational edge.
Lock-In, Staged Buying, and OSB Substitution Triggers
Softwood plywood producer prices rose 15.9% year over year in 2026, while the index covering OSB-inclusive reconstituted wood products gained 8.0%. Plywood climbed about twice as fast, and that gap is why fixed purchasing rules beat gut feel in this market.
When to lock prices
Committed volume: You have clear demand for the next 3–6 months, and a supply gap would hurt the project. Multifamily and large-volume jobs fit this profile.
Price rebound: Benchmark lumber climbs more than 10%–15% from its recent low. Mill closures, extreme weather, or rising log costs also count. North American log costs are up 20%–30% since 2021, so treat that shift as your risk warning line.
Small quote gaps: If a supplier’s quote sits $10–15/MBF above your target, negotiate and lock part of the tonnage. Push spot quotes down by that amount and hold 10–14 days of inventory.
Lock ratio: Cover 50%–70% of base demand. Keep 30%–50% on spot so you don’t carry the full price spike if the market drops.
How to stage orders
Use a 40/30/30 split:
First 40%: Signed projects with confirmed consumption in the next 30–45 days.
Second 30%: Buy early if prices rise more than 5% above the first batch, or lead times stretch by more than 2 weeks.
Flexible 30%: Hold for spot dips, design changes, or an OSB switch.
Keep jobsite stock at 10–14 days. Don’t turn price risk into inventory and cash-flow risk.
Skip full-volume locks in a flat or falling market. OSB prices recently fell across consecutive periods, with the October index dropping 0.9% month over month and 5.2% year over year. Those numbers favor staged or delayed buying.
OSB substitution triggers
Price: Start a feasibility review when plywood carries a 15%–20% premium over OSB. Below that, procurement, redrawing, and switching costs can eat the savings.
Supply: Switch when plywood lead times run 2+ weeks longer than OSB, quotas appear, or a key spec is out of stock twice in a row.
Landed cost: Execute only if OSB still lands 8%–10% below plywood after factoring in extra cutting waste, fasteners, labor, and design review. OSB also wears blades faster, so include higher tooling and processing costs.
Design: Use it only for wall or roof sheathing where shear capacity and dimensional stability matter and local code accepts the OSB grade. Avoid it on exposed faces, assemblies with long-term moisture exposure, or areas with special surface requirements. Compare grade data with an OSB and plywood supplier before ordering.
|
Situation |
Purchasing action |
|---|---|
|
OSB at least 20% cheaper, code allows |
Switch now, covering 30%–50% of volume first |
|
Plywood premium 10%–20% |
Buy in batches and run sample validation on standard wall and roof areas |
|
Plywood premium under 10% |
Keep the current spec |
|
OSB falling, plywood still rising |
Delay OSB lock-in and lock only essential plywood volume |
|
Plywood lead time up 2+ weeks |
Use OSB as the delivery backup and validate critical milestones first |
|
High-finish, exposed, or certified requirements |
Don’t substitute. Keep plywood and lock key specs |
Contract terms to write down
Price validity: 90–180 days.
Lock scope: Spec, thickness, grade, adhesive emission class, edge treatment, packaging, and delivery location.
Batch tolerance: ±10% per delivery, with a delivery window of at least 14 days.
Reopener triggers: Index moves beyond ±10%, tariff or anti-dumping changes, mill shutdowns, or delivery delays beyond 7 days.
Substitution clause: OSB is allowed when its landed cost is 8%–10% below plywood and it meets structural code. Require samples, strength ratings, and third-party compliance documents.
Risk Scenarios: Tariff Shocks, Freight Spikes, and Demand Drops
Pre-tariff buying makes a market look stronger than it is. Importers rush cargo in, then volumes fall off a cliff. Any plywood price forecast needs a stress test for that cycle.
Tariffs Hit Demand First
Uber Freight estimates that every 1% of added tariff cuts truck freight demand by at least 0.15%.
10% tariff: demand falls about 2%.
18%–28% tariff: demand falls 4%–6%.
U.S. port imports could drop at least 20% year over year in the second half of 2025. Strip out early-year front-loading, and full-year volume could fall 15% or more. May port volume was already down 5% year over year and 19% from April. December arrivals are forecast at 2.19 million TEU, against 2.62 million a year earlier. That leaves a gap of more than 430,000 TEU.
Freight Whipsaws Both Ways
Rates rise before tariffs land, then slide once buyers work down stockpiles. Kearney notes that transpacific eastbound rates softened after the tariff-driven July–August peak and should fall further in Q4 2025.
Stress-test your budget with a 50%–100% short-term ocean freight spike, followed by a 20%–40% drop. Calibrate it with live quotes for your lane.
Inland freight is soft too. In October 2025, van, flatbed, and reefer volumes fell 3%, 4%, and 2% month over month, and 11%, 3%, and 7% year over year. Dry van loads are expected to slip 0.9% for 2025, with contract rate increases held under 2%. Dry bulk earnings averaged about $10,750 per day in the first half of 2025, down 30%.
How Thin Margins Break
Take a $100 product with a 20% gross margin.
A $10 tariff cuts gross profit from $20 to $10.
$8 of extra freight leaves $2.
If volume drops another 5%, fixed warehouse, buying, and sales costs spread thinner, and operating profit can turn negative.
Three Risk Scenarios
|
Scenario |
Tariff |
Ocean freight |
Volume |
Response |
|---|---|---|---|---|
|
Mild |
+5% |
+30% |
−3% |
Requote and shorten purchase batches |
|
Neutral |
+10% |
+60% |
−5% to −10% |
Pause low-margin SKUs and add local or regional suppliers |
|
Severe |
+20% to +28% |
+100% |
−15% to −20% |
Cut inventory, lock alternate routes, and cap purchases by cash flow, not sales |
Plywood Price Index and Market Tracking Checklist
The best plywood price index is the one you can pull yourself every month, for free. The U.S. Bureau of Labor Statistics publishes several series through FRED. Together, they show whether quotes are drifting up before your supplier tells you.
Core index readings (data through September 2026)
|
Series |
Latest reading |
Recent move |
|---|---|---|
|
Plywood PPI (WPU083), 1982 = 100 |
303.660 (Sept) |
Up 5.1% from 288.925 in May |
|
Softwood veneer and plywood PPI (WPU0831) |
342.233 (Sept) |
Up 6.3% from 321.977 in May |
|
Plywood and engineered wood manufacturing (PCU3212132121), Dec 2003 = 100 |
169.692 (Sept) |
Up from 167.173 in Aug |
|
Softwood veneer and plywood manufacturing (PCU321212321212) |
253.757 (Aug) |
Up 4.0% from 244.003 in May |
|
Lumber and plywood composite (WPUSI004011) |
287.365 (Sept) |
Down 0.7% from 289.416 in Aug |
The composite slipped while the plywood series kept climbing. That split shows plywood prices are moving independently of broader lumber trends.
Spot and supplier price references
U.S. market: about $555/ton in Q3 2026.
China market: about $400/ton in Q3 2026. That is $155/ton below the U.S. level before freight and duties.
Commercial plywood from China: $6–36 per sheet, MOQ 400–1,000 sheets.
18mm film-faced construction plywood: $11–20 per sheet, MOQ 200–900 sheets.
18mm black-film phenolic plywood: $14.80–17.50 per sheet, MOQ about 900 sheets.
Bulk poplar plywood: $150–600/m³, or from 21 CBM.
Treat these as initial listing prices rather than settled transaction figures. Use them to flag outliers when reviewing bids from a commercial plywood manufacturer.
Your tracking checklist
|
What to track |
What to record |
How often |
|---|---|---|
|
Plywood PPI |
WPU083 index, month-on-month and year-on-year change |
Monthly |
|
Softwood plywood PPI |
WPU0831 index, month-on-month and year-on-year change |
Monthly |
|
Manufacturing prices |
PCU3212132121, PCU321212321212 |
Monthly |
|
China export quotes |
1220×2440mm, thickness, core, USD/sheet |
Weekly |
|
Landed cost |
FOB, freight, insurance, duties, port fees |
Weekly or per shipment |
|
Raw materials |
Logs, veneer, adhesives, phenolic film |
Monthly |
|
Supplier terms |
MOQ, lead time, capacity, payment terms |
Every inquiry |
|
Quality specs |
E0/E1, CARB2, CE, FSC, EN 314, WBP |
Every batch |
|
Demand |
U.S. housing starts, permits, furniture orders |
Monthly |
|
Stock and lead time |
Supplier stock, port stock, production cycle |
Weekly |
What every supplier quote must include
Ask for all of this in one reply so quotes compare side by side:
Product type: commercial, furniture, marine, film-faced, phenolic, or structural
Size and thickness: 1220×2440mm or your spec; 9, 12, 15, 18, or 21mm
Core: poplar, eucalyptus, birch, pine, or mixed
Glue: MR, E0/E1, WBP, or phenolic
Surface: raw, black film, brown film, or anti-slip film
Certifications: FSC, CARB Phase 2, EPA TSCA Title VI, CE, EN 13986
Price basis: FOB main Chinese port and CIF destination port, in USD per sheet and USD per m³
MOQ: sheets or CBM
Packing: pallets, sheets per pallet, gross weight, volume
Lead time: days from order confirmation to container loading
Payment: T/T split, letter of credit, or credit terms
Price validity: at least 15–30 days
Trigger rules
Plywood PPI up more than 3% in a month: requote and lock supply.
Chinese quotes up more than 5% for two straight weeks: compare alternative cores and thicknesses.
Ocean freight above 15% of purchase cost: evaluate full containers, nearby suppliers, or regional warehousing.
Quote more than 20% below the market range: check moisture content, voids, core ply count, and certifications first.
MOQ above 900–1,000 sheets: ask for mixed containers, split deliveries, or CBM-based pricing.
Log the date next to every figure, and refresh the sheet each quarter.
Conclusion
The market gives you signals rather than a perfect buying window, and you now know where to find them.
Three takeaways matter most. First, raw log costs and trade policy set the price floor, while housing starts and furniture demand drive the ceiling. Second, FOB quotes leave out freight, currency rates, and duties, which determine your actual landed cost. Third, timing beats guessing. Staged purchases, price locks tied to clear triggers, and an OSB fallback protect your margin whichever way the plywood price forecast turns.
Next, open the tracking checklist, pick the five or six indicators that touch your products, and set a quarterly review date. Then go back to your supplier with data.