
Companies are making wood panel procurement decisions worth millions on incomplete data. The gap between guesswork and precision could cost your organization dearly by 2027. As plywood, MDF, particleboard, and OSB manufacturers deal with raw material volatility and tightening environmental regulations, the numbers behind this Global Wood Panel Market Outlook 2027 tell a far more nuanced story than most industry summaries reveal.
We’re breaking down the plywood market forecast, MDF demand curves, and particleboard growth trajectories by region—Asia-Pacific’s construction-driven surge versus Europe’s sustainability-mandated shifts—with hard CAGR figures and market share percentages you can cite directly. We’ll also map how leading manufacturers like Kronospan and Egger are handling rising timber costs and compliance pressures.
If you’re building a procurement strategy or an investment thesis, the data ahead will save you hours of cross-referencing scattered reports and might change which markets you prioritize next.
2027 Global Wood Panel Market Size, Volume and Growth Rate
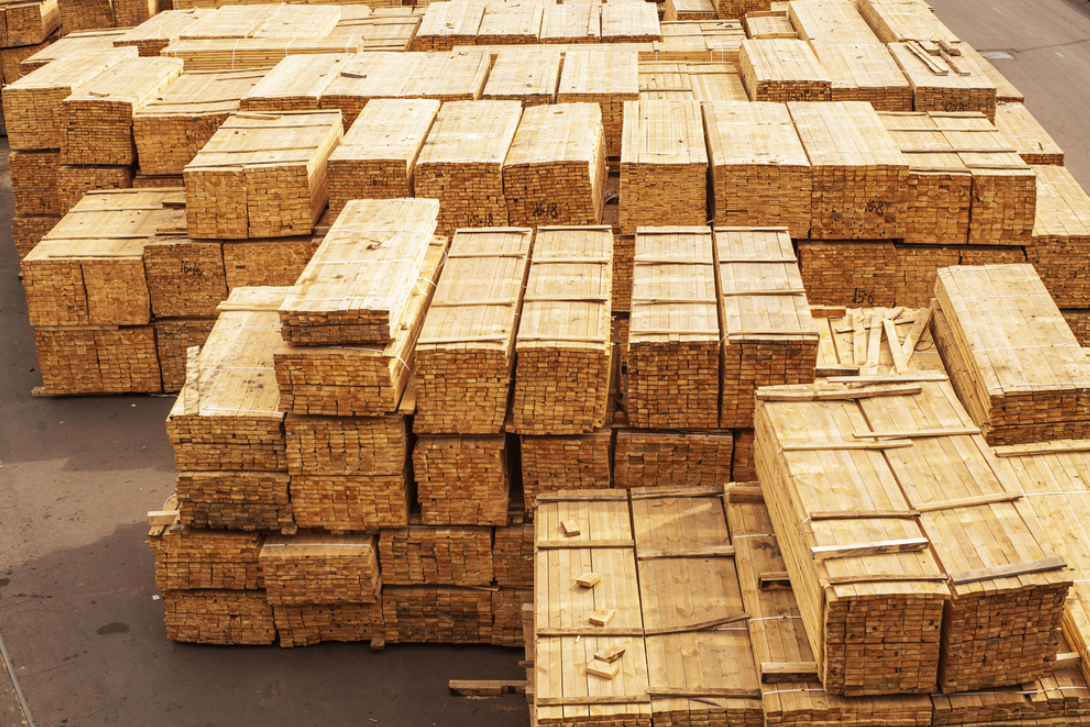
Numbers first. The global wood panel market moved 444.1 million cubic meters in 2020. By 2027, that volume climbs to 658.1 million cubic meters—a 5.8% CAGR stretched across seven years of construction booms, furniture manufacturing expansion, and infrastructure spending. That’s a market adding the equivalent of dozens of mid-sized national supply chains in raw volume alone.
Dollar figures tell a similarly aggressive story, though the range depends on who’s counting. IMARC pegs the value at US$225.1 billion by 2027, up from US$155.3 billion in 2021—a 6.15% CAGR. Another widely cited estimate lands at US$220.06 billion, with growth running hotter at 7.5% CAGR. Two other benchmarks—US$195.5 billion and US$232.6 billion—bracket the range further, reflecting differences in scope (some include specialty panels, others don’t) and base-year assumptions.
Strip out the noise and you get workable figures for planning purposes:
-
Volume: 658.1 million m³ by 2027
-
Value: US$220.1 billion to US$225.1 billion
-
Growth rate: 5.8% to 7.5% CAGR, depending on source and scope
That spread matters. A 1.7-point CAGR gap, compounded over seven years, changes your revenue projections by tens of billions. If you’re modeling procurement budgets or investment returns, pick your source deliberately—and disclose which growth assumption you’re running with. The wood-based panel manufacturers already competing for share are watching all of these figures closely, because pricing power in 2027 depends on which growth curve actually materializes.
Plywood Market Forecast: 2027 Revenue Share and Demand Outlook

Plywood’s numbers split into three distinct camps, and picking the wrong one skews your entire plywood market forecast model. The tightest cluster falls between USD 61.3 billion and USD 73.3 billion by 2027, running at 5.2% to 6.2% CAGR. Newer datasets push slightly higher into the low-to-mid US$80 billions—one model cites USD 86.03 billion by 2027, up from US$81.88 billion in 2025. A separate broader forecast claims USD 152.8 billion, but treat that as an outlier, not a planning baseline.
Technavio offers something more actionable. The market adds USD 13.59 billion between 2022 and 2027 at 4.55% CAGR, driven almost entirely by residential and commercial construction.
Regional concentration is stark. Asia-Pacific controlled 77.0% of plywood revenue in 2021 and is growing at 6.6% CAGR. Nearly four out of five plywood dollars flow through APAC supply chains. That’s dependency, not diversification.
Product segment matters too. Hardwood plywood is outpacing softwood, with growth exceeding 8.2% in some forecasts, tied directly to furniture manufacturing demand.
The U.S. market looks sluggish by comparison: USD 24.23 billion in 2025, climbing to USD 32.09 billion by 2035 at just 2.85% CAGR. If your procurement strategy assumes uniform global growth, this data says otherwise.
MDF Market Outlook: Furniture, Interior and Decorative Panel Demand
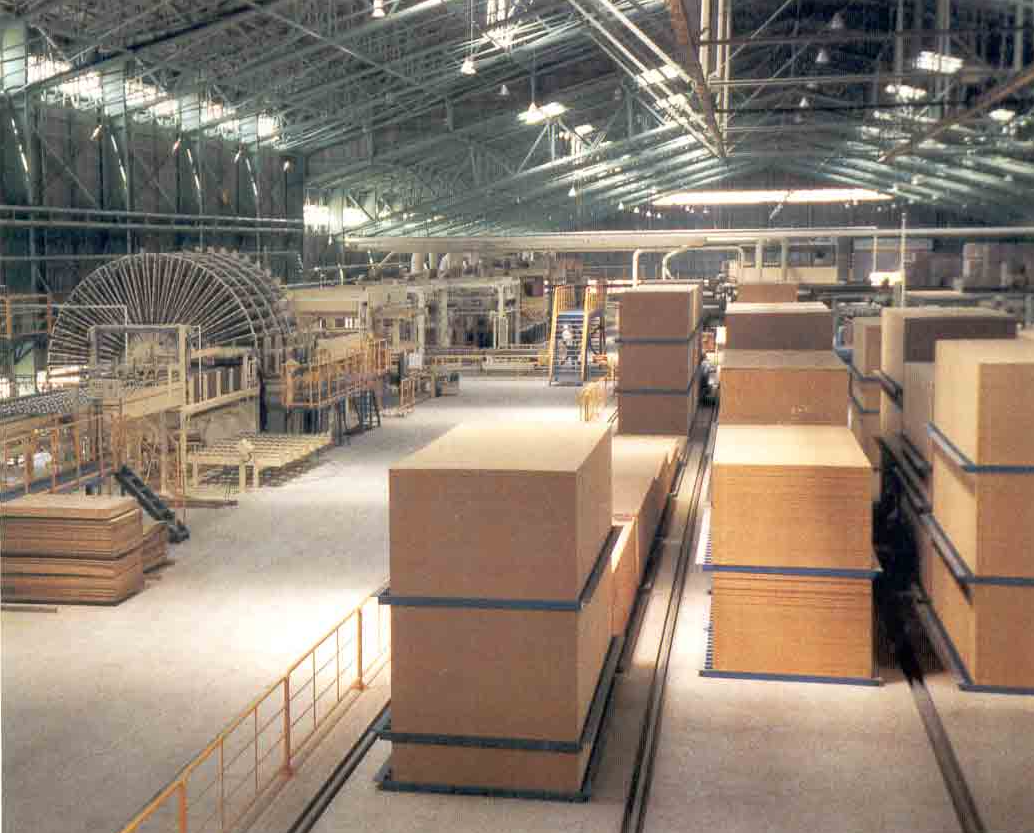
Furniture manufacturing drives every credible MDF market outlook through 2027 and beyond. Forecasts vary widely depending on scope. On the conservative end, the market moves from USD 29.91 billion in 2026 to USD 40.2 billion by 2035 (3.34% CAGR). The aggressive end shows USD 44.96 billion in 2025 reaching USD 82.24 billion by 2033 (8.2% CAGR). A third estimate lands at USD 48.50 billion in 2026 to USD 84.75 billion by 2033, running 8.3% CAGR. That’s a spread wide enough to double your projections depending on which base year and methodology you trust.
Furniture dominance isn’t debatable, though. One report puts furniture at 59.7% of global MDF revenue in 2025, tagged as the fastest-growing segment at 8.1% CAGR. A volume-based study lands lower—51.10% of 2025 volume, 4.04% CAGR to 2031—but the direction is identical. Global MDF production topped 115 million cubic meters in 2024, with more than 67% consumed by furniture and interior products combined.
Interior decoration is the second pillar, roughly 24% of demand—wall panels, millwork, flooring, doors, cabinet manufacturing. Decorative overlays add another layer: USD 472.80 million in 2026 growing to USD 823.05 million by 2036 at 5.7% CAGR, fueled by kitchen cabinet renovation and premium surface finishes.
Asia-Pacific holds 46.2% of the MDF market in 2025, tied directly to modular furniture and customized interior renovation work.
Particleboard Industry Analysis: Cost-Sensitive Furniture and Construction Use
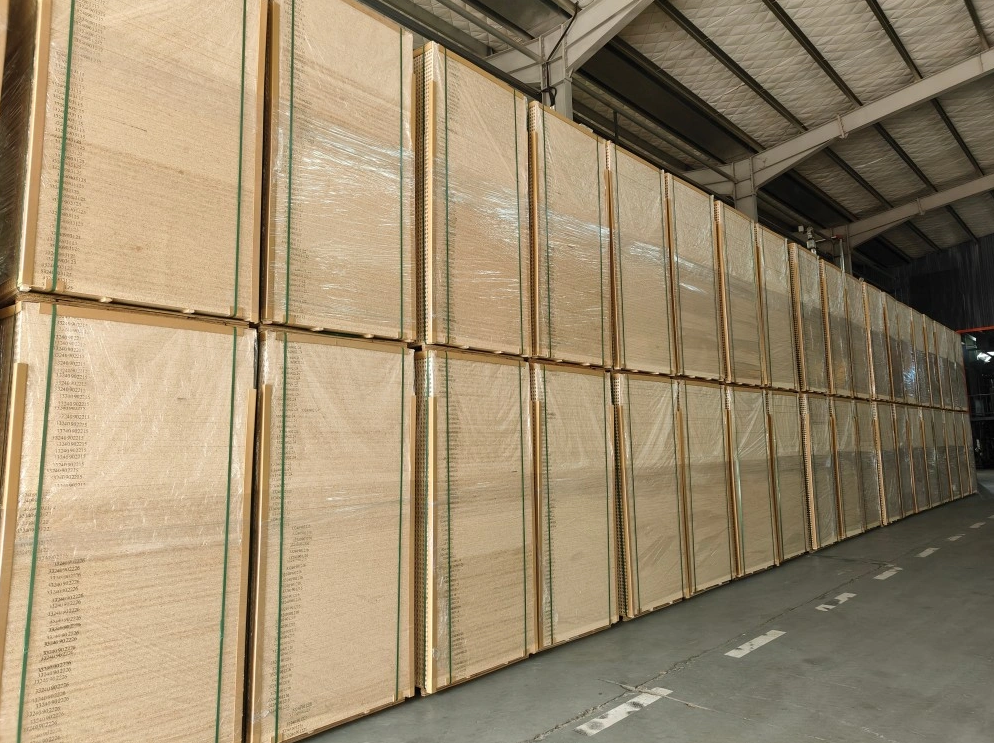
Price wins here, full stop. The particleboard market hits about USD 24.72 billion in 2025, climbs to USD 29.86–29.9 billion in 2026, and may reach USD 30.16 billion by 2031 or as high as USD 51.0 billion by 2036. Volume tells a tighter story: 117–120 million cubic meters in 2025, rising to 120–123 million cubic meters in 2026, at a 2.65%–2.72% CAGR through 2031.
Regionally, North America grows fastest—15.41 million cubic meters in 2026 to 19.69 million by 2031 at 5.02% CAGR. Europe stays bigger but slower, moving from 29.53 million to 35.61 million cubic meters at 3.82% CAGR. India has the sharpest trajectory, going from USD 0.79 billion to USD 1.27 billion by 2031 at 9.98% CAGR.
Furniture industry wood panel demand absorbs roughly 60% of output. Construction sector wood panel usage takes another 25%, exceeding 18 million cubic meters annually. That is the demand split driving flat-pack furniture, kitchen carcasses, and budget fit-out.
Emission grades separate mainstream from premium. E1 (0.10 mg/m³, EN 717-1) covers cost-sensitive furniture. E0 (0.05 mg/m³) targets sustainable wood panel production for children’s furniture and medical interiors—where wood-based panel manufacturers now compete hardest on resin, wood-chip, and lamination economics.
OSB Market Trends and Structural Panel Growth
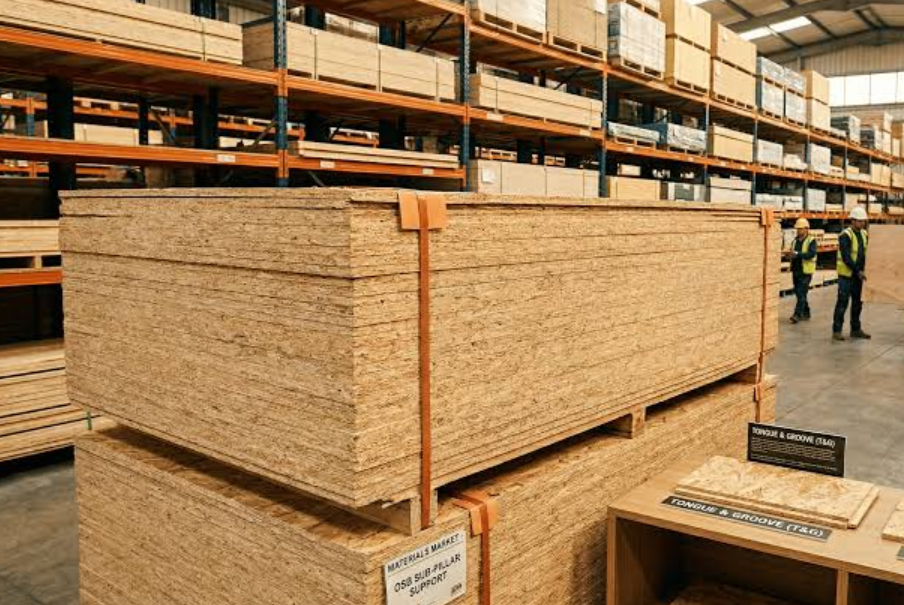
Structural sheathing doesn’t make headlines. The OSB market numbers, however, deserve attention. Volume-based forecasts put the market at 42.25 million cubic meters in 2026, rising to 50.50 million by 2031, a 3.63% CAGR. A slightly older estimate lands lower, at 36.3 million cubic meters in 2025 growing to 50.79 million by 2031 (5.0% CAGR). Revenue-based models give a wilder picture. One projection jumps from USD 32.5 billion in 2026 to USD 90.2 billion by 2034, implying 13.6% CAGR. That gap shows methodology, as much as market reality, drives the swings.
Three forces explain the growth. Plywood substitution contributes +0.9% CAGR, strongest in North America and emerging Asia-Pacific. Construction expansion adds +0.8% CAGR across North America, Europe, India, and Southeast Asia. Sustainability-driven demand adds +0.7% CAGR, led by Europe and North America.
Europe alone moves from USD 7.96 billion in 2026 to USD 12.60 billion by 2034 (5.90% CAGR), backed by the fact that 31% of new EU single-family dwellings now use timber-frame construction.
Pricing confirms tight supply. Canadian OSB hit USD 343/MT in June 2026, with both North American and European markets showing upward Q1 2026 price movement tied to steady housing demand and constrained timber supply. Formaldehyde emissions rules and REACH compliance remain the sharpest regulatory edge, particularly for European producers chasing that sustainable-panel premium.
Wood Panel Regional Market Analysis: Asia-Pacific, Europe and North America
Where you source from determines your cost and the compliance headaches you inherit. That supply chain reality plays out differently across three regions. The broader wood-based panel market has two valuation estimates. One sees USD 161.9 billion in 2026 climbing to USD 252.6 billion by 2035 at 5.1% CAGR. Another, more conservative, sees USD 131.01 billion to USD 177.03 billion (3.9% CAGR). Volume estimates are more consistent. They go from 419.99 million m³ in 2025 to 434.36 million m³ in 2026, heading toward 513.79 million m³ by 2031 at 3.42% CAGR.
Asia-Pacific remains the volume king. The region held 52.12% of 2025 shipments and controlled 61% of global wood-based panel production back in 2018 (248 million m³ out of the global total). Value estimates range from USD 69 billion in 2026 to USD 108.9 billion by 2035 (5.2% CAGR). One narrower model cites USD 24.27 billion in 2025 rising to USD 25.08 billion in 2026. Sourcing signals here point toward thin board, plywood decking, pallet panels, and prefabricated cross-laminated timber tied to export furniture and logistics hubs.
Europe plays the compliance card. It accounted for 35% of global production in 2018 (170 million m³). Another figure pegs 2018 output at 90 million m³, or 22% of global share. Scope differences explain the gap. One model values Europe at USD 25.08 billion in 2026, growing at 3.8%. Another assigns a 22.6% share and points to recycled furnish lines, EPD compliance, and resin conversion as the real investment story. EU structural panel production sat near 12.5 million m³, with imports around 12.0 million m³.
North America is large but wobbling. The region held 26% of 2018 global production (129 million m³) by one count, 12% (48 million m³) by another. Production fell 10.3% in 2023, landing back at 48 million m³. One model places the region at USD 38.07 billion in 2026, a 23.50% share. Big money, but supply is softening.
Raw Material Price, Species Supply and Wood Panel Cost Sensitivity
Fir and spruce sawn wood tracks OSB pricing almost tick for tick. Cost passes through from stump to finished panel with little friction absorbed along the way.
Input drivers differ by panel type. Plywood depends on veneer supply, log quality, glue costs, and labor. MDF and particleboard depend on fiber, resin, glue, energy, and services. OSB lives and dies by sawlog and softwood input costs, fir and spruce in particular. Raw wood availability is the first-order variable. Weather disruption, harvest restrictions, or forest policy can choke log flow within a single quarter.
Resin acts as the second lever. When petrochemical-linked resin prices climb, panel offers follow. Europe got hit hardest. Particleboard and MDF pricing there stayed 30–50% above 2019 levels into early 2024, driven by elevated coniferous plank-wood costs and thinner Russian supply that imports never fully replaced.
For CLT and mass timber, lumber cost eats 40–60% of total manufacturing cost. Species selection (Douglas-fir, Southern Yellow Pine, spruce, or pine) decides your margin exposure more than almost any other input.
Before locking a quote, ask:
-
Which species, exactly?
-
Domestic or imported origin?
-
What input grade—log, veneer, fiber?
-
Does the price carry resin, energy, freight, or certification surcharges?
Single-species softwood exposure means higher sensitivity to regional shortages. MDF and particleboard quotes track fiber, resin, and energy more than any one log source.
Environmental Regulations, Sustainable Production and Compliance Cost Impact
Compliance costs split into two buckets, and most procurement teams only budget for one. One-off costs cover due-diligence policy development, monitoring and reporting systems, and staff or supply-chain training. Recurring costs hit every year after: dedicated compliance staff, system maintenance, ongoing data collection and analysis. Miss the recurring line, and your five-year cost model breaks by year two.
Scale matters more than most panel buyers assume. For over 82% of U.S. industrial sectors, total environmental-law cost stays under 1% of total shipment value. That’s the low-cost benchmark. Regulated process industries tell a different story. U.S. steel-industry environmental costs ranged from $8.86 to $18.94 per short ton, split between capital expenditure ($0.67–$6.36/ton) and operating expense ($4.95–$13.84/ton). Agriculture sits similarly exposed. One 2006 study logged $109.15 per acre in compliance costs, 4.25% of cultural costs.
Sustainable wood panel production now falls into that higher-exposure category. CBAM, REACH, RoHS, and IFRS S2 all touch panel manufacturers directly. Without sector-specific figures, use 1–5% of production cost as your working compliance benchmark. Then watch automation platforms claiming 70–75% reductions in EPR/PPWR reporting labor. That’s where margin gets recovered.
Global Wood-Based Panel Manufacturers and Competitive Strategies
No single company owns this market. Kronospan, EGGER, Arauco, West Fraser, Georgia-Pacific, Boise Cascade, Weyerhaeuser, Swiss Krono, Pfleiderer, Sonae Arauco, Kastamonu Entegre, Duratex, Dongwha Group, Roseburg Forest Products, and LP Building Solutions all show up repeatedly as the core competitive set among wood-based panel manufacturers, but the share numbers stayed surprisingly thin at the top.
One estimate puts Kronospan at 12% global share, running across 30+ countries with 25+ million m³ of annual output. West Fraser sits at 10%, backed by 20 million m³ combined across OSB, plywood, and MDF. Another source frames it differently: the top five players (West Fraser, EGGER, Arauco, Kronospan, Weyerhaeuser) held just 10.5% combined share in 2025. Fragmented, not consolidated.
Strategic patterns repeat across the leaders:
-
Vertical integration — timber ownership straight through to finished panel (Georgia-Pacific, Weyerhaeuser)
-
Geographic diversification — multi-continent plants reduce single-region exposure (Kronospan, Arauco)
-
Product diversification — MDF, particleboard, OSB, plywood, and decorative laminates under one roof (West Fraser, EGGER)
-
Sustainability positioning — eco-manufacturing as a European differentiator, especially at Kronospan and EGGER
Duratex remains the benchmark producer for the Southern Hemisphere, dominating Latin American panel supply out of Brazil. For procurement teams, scale distribution, not brand loyalty, should drive supplier diversification decisions.
Wood Panel Supply Chain, Trade Flows and 2027 Procurement Implications
Trade flows tell you what raw numbers can’t. The global wood-based panel market sits at US$222.0 billion in 2026, projected to hit US$331.6 billion by 2033 at 5.9% CAGR. Volume runs from 434.36 million m³ in 2026 to 513.79 million m³ by 2031, a 3.42% CAGR. Behind those figures sits a shipping network that’s getting riskier.
China dominates export value at US$7.5 billion, roughly 17% of global exports. Canada trails at 8.2%. The U.S. remains the largest buyer, absorbing 17% of global imports. For HS940350, China (61%), Vietnam (28%), and Malaysia (9%) covered over 95% of January 2026 value. That’s concentration risk.
Demand pulls are shifting geography. Vietnam, Thailand, and the Philippines imported over 8 million m³ in 2025. UAE and Saudi Arabia took 2.3 million m³, up 17% YoY. Germany, the UK, and France held steady at 4.5 million m³.
Logistics are the real threat. Cape of Good Hope rerouting added 10–18 days transit in 2026. Softwood plywood prices swung between US$423.94/m³ and US$462.25/m³ across European clusters mid-2026.
For 2027 procurement, prioritize documentation, compliance, and dual-sourcing over lowest unit price. Extend order horizons, build larger safety stock, and re-quote more often. China/Vietnam/Malaysia-into-U.S./Europe/Gulf lanes carry the highest exposure. Hedge accordingly.
Conclusion
The numbers tell a clear story: by 2027, the wood panel industry won’t just grow—it will reshuffle. MDF and OSB are pulling ahead as furniture makers and builders chase engineered wood products that balance cost with sustainability compliance. Asia-Pacific keeps flexing its manufacturing muscle, while Europe’s regulatory push is quietly rewriting the cost structure for every producer in the game.
If you are sitting on procurement or investment decisions, the Global Wood Panel Market Outlook 2027 data here is actionable. Raw material volatility and shifting trade flows mean the window to lock in favorable supplier contracts or position capital ahead of demand curves is narrowing fast.
Don’t wait for Q3 reports to confirm what the data already shows. Benchmark your sourcing strategy against these regional and product-level forecasts now. In this market, the companies reading the signals early are the ones writing next year’s growth story, not reacting to it. For a closer look at how an established panel manufacturer navigates these shifts, see Baier’s company background.