
Chile’s wood panel sector sits at a crossroads few importers are watching closely enough. Domestic MDF production can’t keep up with construction and furniture demand, and the widening gap is quietly reshaping sourcing strategies across the region. Understanding Chile MDF industry trends and where imported wood panels fit in used to be optional; now it’s central to any procurement decision in this market.
This analysis covers what’s actually driving that gap: production capacity that’s shifting, export patterns that don’t always match local supply needs, and a regulatory environment tightening around sustainability. We’ll also compare MDF to particleboard and OSB on real commercial terms, and look at where the medium density fiberboard supply chain is headed through 2029. For buyers weighing their next move, the data here should sharpen the picture considerably.
Chile MDF Industry Overview: Production Scale and Market Position
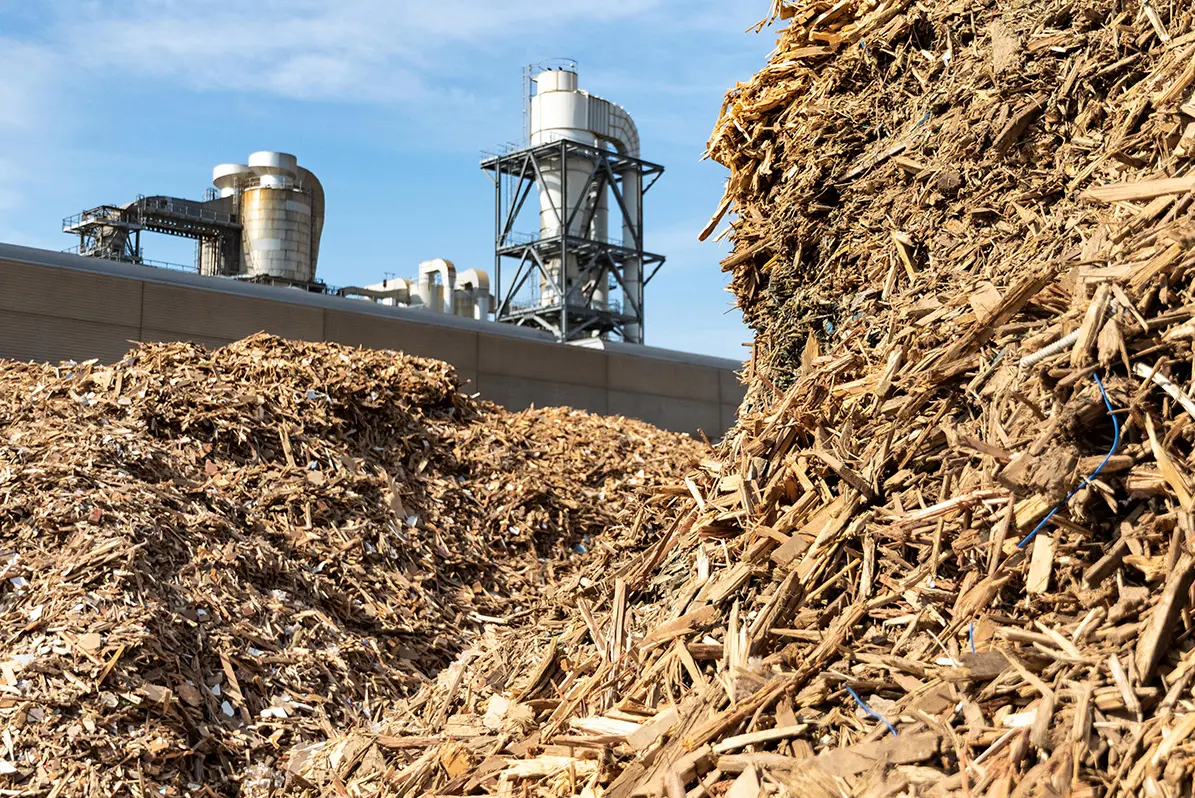
The numbers tell a concentrated story. In 2018, Chile’s wood-based panels industry hit a record 3.37 million m³, climbing 6.1% from the prior year. MDF drove that growth. Historical 2018 production data shows 922,014 m³—a 27.4% slice of total national panel output, making it the single largest product category ahead of particleboard’s 561,144 m³ (16.7% share).
That’s a meaningful data point for anyone tracking Chile timber industry trends. But what defines the market is this: only two companies produce MDF domestically. Masisa and Maderas Arauco control the entire supply.
Plant footprint breakdown:
– Masisa runs two facilities—San Pedro de la Paz and Cabrero, both in Biobío Region
– Arauco operates one plant, Planta Cholguán, in Ñuble Region
Three plants. Two companies. That’s the full domestic MDF manufacturing base in a country with wood-based panel capacity around 4.1 million m³.
This concentration matters for buyers. In fragmented supplier markets you can shop dozens of mills. Chile’s structure puts pricing power and supply flexibility in the hands of a small number of wood-based panel manufacturers. 30% of 2018 MDF output was exported, which tells you domestic demand alone doesn’t absorb full production—there’s an outward flow built into the system.
Arauco’s global scale adds another layer. The company’s broader panel operations span eight facilities across Chile, Argentina, and Brazil, with installed capacity exceeding 3.2 million m³. That’s part of a larger engineered wood products network with international reach.
MDF Production Capacity & Domestic Consumption Trends
To put Chile’s numbers in perspective, world MDF production hit 118.5 million m³ in 2023, up 4.2% year-over-year, with Asia driving most of that expansion. China alone accounts for roughly 45-49 million m³ of capacity, nearly half the planet’s MDF output, while domestic consumption there absorbs about 42 million m³, an 85-93% utilization rate. That’s the benchmark for smaller producing nations.
India offers a sharper comparison. Capacity grew from 0.15 million m³ in 2010 to 1.8-1.9 million m³ by 2021, a 12x jump, and 2023 production reached 5.3 million m³. Domestic demand there consistently outpaces new supply, driven by urbanization and custom furniture penetration.
Chile doesn’t operate at that scale, and it shouldn’t be expected to. Rising furniture demand, cabinet applications (which account for 22% of global MDF output), and construction-driven consumption are straining a three-plant domestic base. The global MDF market itself is projected to grow from $25 billion in 2024 to $35 billion by 2033, a 3.8% CAGR. Sustainable wood panel production and engineered wood products are absorbing that growth faster than plywood or traditional fiberboard, which is exactly the pressure point reshaping Chile’s supply-demand balance today.
MDF Export Market Trends: Chile’s Position in Global Trade
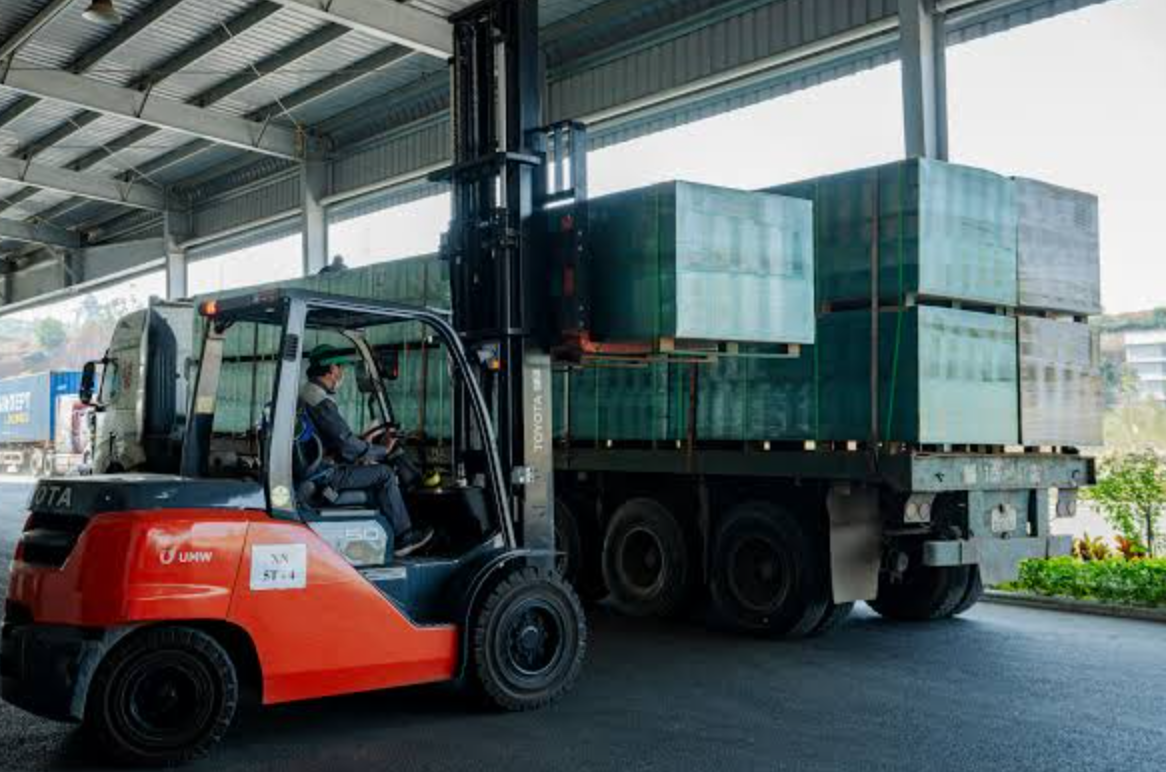
Chile ranked 5th globally in MDF (>9mm) exports by value in 2023, at $286 million, trailing only China ($622M), Germany ($570M), Turkey ($550M), and Thailand ($495M). Global MDF export value dropped 20.6% year-over-year, from $637M to $506M. Chile held its ground while the category contracted.
The US market tells the real story. Fastmarkets data shows Chile shipped 497,241 m³ of MDF to the United States in 2022, up 33%—the 10th consecutive year of growth since 2013. Volume roughly doubled from 2015 levels. Chile overtook Canada as the top foreign MDF supplier to the US, both by volume and value ($252M versus Canada’s $245M). Chile, Canada, and Germany together control 66% of US MDF import value.
Mexico ranks as Chile’s third-largest forestry export destination, with MDF panels among the core products. IndexBox data places Chile second to Brazil in Latin American MDF exports for 2025.
Radiata pine MDF moldings grew 94% in export volume, now representing 52% of total molding exports, ahead of solid wood equivalents.
Imported Wood Panels Into Chile: Niche Demand and Sourcing Patterns
Not every board Chile uses comes from Masisa or Arauco. Those two dominate domestic MDF output, but Chile still imports panels—just not where you’d expect. The country exports commodity board and imports specialty product, a pattern that matters if you study Chile construction material imports. Chile does not mainly import commodity MDF; import opportunities are concentrated in specialized products that local mills do not prioritize.
| Category | Value | Year | Main Application/Notes | Change |
|---|---|---|---|---|
| Plywood, veneered panels & laminated wood (HS 4412) | $36 million | 2023 | – | – |
| OSB | $28.6 million | 2017 | Mostly construction-bound | – |
| MDF | $14.5 million | 2017 | Largely furniture manufacturing | – |
| Wood board agglomerated (non-standard panel category) | $0.19 million (2024), $0.2 million (previous) | 2024 | – | -5.39% |
That last figure is the tell. Chile produces Standard MDF and plywood at scale, so imports concentrate in what local mills don’t make competitively: melamine-faced boards, non-standard thicknesses, decorative HDF surfaces. Globally, 10–50mm panels cover 52% of demand, but specialty segments outside that band—thin HDF for laminate substrates, thick structural MDF—carry 10–30% price premiums. Applied to Chile, an estimated 10–15% of panel import value ties to high-spec boards: melamine-faced, high-gloss, fire-retardant, or moisture-resistant grades.
Sourcing follows two distinct paths. Regional suppliers from Brazil and Uruguay offer 2–4 week lead times and shorter transit, a pattern that stuck after post-earthquake reconstruction pulled panels in from across the region. Asian suppliers offer deeper design catalogs and 10–20% lower ex-mill pricing, but 5–8 week lead times narrow that advantage once freight and inventory carrying costs get factored in. For urgent or mid-volume orders, regional wins. For repeat, high-volume decorative runs, Asia still competes.
Chile MDF Market Growth Forecast (2025-2029): Key Drivers
Chile’s MDF market will grow steadily from 2025 to 2031. For anyone modeling procurement timelines against Chile MDF industry trends, that signals a market driven by fundamentals, not speculation.
Three forces are pulling the market along. Urbanization keeps feeding residential and commercial project pipelines, and each new build adds incremental MDF demand for wall systems, interior linings, and structural components.
| Key Aspect | Details |
|---|---|
| Role in Interior Design & Furniture |
|
| Market Growth (2025 Report) |
|
| Specification & Procurement Trends |
|
Chile’s installed MDF capacity sits at roughly 1,155,000 m³, with no visible expansion in the pipeline. That constraint shapes everything downstream. Growth through 2029 won’t come from new mills; it depends on how efficiently existing capacity gets utilized and how much slack imported wood panels fill in.
Headwinds worth tracking: fluctuating raw material prices, which feed directly into MDF pricing trends; ongoing competition from plywood and particleboard in cost-sensitive applications; and tightening environmental regulation, which pressures producers but also boosts MDF’s relative appeal.
Prefabricated housing policy adds a quieter tailwind. Government programs promoting efficient, sustainable construction methods indirectly lift demand for engineered wood products, MDF included, across walling and interior components. For buyers, that policy layer is worth watching alongside the raw production numbers.
Sustainability and Regulatory Shifts Shaping MDF Demand

Formaldehyde compliance is changing the rules for sustainable wood panel production. About 29% of global MDF demand now comes from sustainability-driven purchasing, and 35% of new MDF projects use recycled wood fibers. Regulators aren’t waiting around—the World Bank projects a 30% increase in sustainable material mandates by 2025.
The standards buyers now ask for: – E1: ≤0.124 mg/m³ formaldehyde emission (EN 717-1) – E0: stricter, now requested by premium EU and Asian brands – CARB Phase II / TSCA Title VI: North America’s de facto global benchmarks
Chile-specific regulation data is thin, but the pressure is real. Latin American exporters chasing EU and US buyers are aligning with E1/E0 and CARB Phase II anyway. Market access demands it. That compliance isn’t free. CARB Phase II-type standards have pushed production costs up about 11%, and 38% of new MDF installations added emission-control systems between 2023 and 2025.
FSC certification carries weight too—20-40% of technical sourcing scores in ESG-driven procurement, with emission class often weighted even higher. For Chile’s wood-based panel manufacturers, non-compliance is a trade barrier.
Competitive Landscape: MDF vs Substitute Materials (Plywood, OSB, Particleboard)
Price and performance rarely align in wood panels, and Chile’s market proves it. Particleboard and MDF together make up 55-60% of total panel volume, while plywood and OSB fill the rest. In Chile, particleboard plus MDF cover over 50% of consumption, plywood holds 30-35%, and OSB stays under 15%—mostly in construction sheathing where it competes directly with plywood, not MDF.
Where MDF wins and loses on the numbers: – MDF bending strength runs 20-40 N/mm², roughly double particleboard’s 11-20 N/mm² range – Plywood still beats MDF on strength, often exceeding 35-60 N/mm²—about twice MDF’s rating – Mdf Price sits 10-30% below cabinet-grade plywood on a standard 19mm sheet – Particleboard undercuts MDF by another 10-25% in LatAm furniture applications
Moisture tells a different story. MDF swells 15-30% after 24-hour water exposure; plywood stays under 10%. That gap explains why plywood cabinets last 25-40 years against MDF’s shorter lifespan in wet environments.
For interior décor, painted doors, and CNC-machined panels, MDF’s smooth surface wins outright. For structural or moisture-heavy applications, plywood and OSB hold their ground.
South American Regional Context: MDF Import/Export Dynamics
The Latin America MDF picture right now is uncomfortable: the regional market has contracted for a third straight year in 2025. Yet exports climbed, and import values spiked. It’s a supply glut dressed up as trade activity. Export prices dropped year-over-year across the region, import prices fell in step, and the pattern points to oversupply, inventory clearing, and cross-border price competition.
Brazil dominates this equation. It accounts for over 70% of Latin American MDF consumption, the undisputed center of gravity for the medium density fiberboard supply chain in South America. Brazil’s H1 2025 particleboard/MDP exports still dropped from $60.7 million to $53.9 million, an 11.2% decline. China kept buying anyway, up 25.4% on Brazilian MDP imports. São Paulo state, meanwhile, bucked the national trend; exports there grew 14.0%, from $12.2 million to $13.9 million, showing how concentrated South America’s export capacity is.
Chile’s slice is smaller but real. In Mexico’s sub-5mm MDF market, Chile holds 12.81% share against the US’s 41.52% and Brazil’s 33.84%, a top-three position but a niche player. The broader Latin American MDF market sits around $2.06 billion, roughly 5% of global MDF revenue: mid-sized, but too strategically located to ignore.
Future Outlook: Value-Added MDF Opportunities for Importers and Distributors
Commodity boards won’t be where the money is. Global MDF volume is set to climb from 126.45 million m³ in 2026 to 152.05 million m³ by 2031—a 3.76% CAGR—and furniture applications already claim 51.10% of that volume, growing even faster at 4.04% CAGR. Residential demand, at 65.91% of consumption, is pulling the market toward pre-finished, moisture-resistant boards. Importers should be positioning inventory there, not in raw commodity MDF.
Global capacity tells the margin story. Installed capacity sits at 88.107 million m³, but future projects push that toward 134.331 million m³. CareEdge already flags margin compression of 400-500 basis points as new supply and imports flood in. Selling standard board into a saturated Chilean market means competing directly on price against Masisa and Arauco. That’s a losing game.
Three niches carry real premiums:
- UV-coated MDF/HDF—factory-finished panels with surface hardness 2-3x conventional melamine, commanding 15-30% price premiums over raw MDF
- Custom-density boards—high-density grades above 800 kg/m³ for CNC-machined components and flooring substrates, low-density options near 550-600 kg/m³ for lightweight export furniture
- Thin HDF (2-6mm)—for laminate flooring and door skins, a segment Latin American mills barely touch
CNC adoption tightens the spec requirements further. Tolerances are now ±0.1-0.2mm on thickness, density variation under 5%. Suppliers who deliver calibrated, sanded boards ready for automated lines can charge 10-20% above unsanded commodity stock. For distributors serving Chile’s construction material imports pipeline, that’s the margin worth chasing.
Strategic Buyer Checklist: Evaluating MDF Suppliers for the Chilean Market
Six categories separate a reliable MDF supplier from a costly mistake. Serious buyers score against all of them before signing.
Technical performance: Nominal density with tolerance, stated as 700 ± 30 kg/m³, not a vague range. Modulus of rupture above 20-25 N/mm², internal bond ≥0.6 N/mm². Thickness tolerance under ±0.2mm. Get lab reports (EN 622-5 or ASTM D2395) dated within 12 months.
Environmental compliance: E1 (≤0.124 mg/m³) as baseline, E0 for premium projects. You need FSC, PEFC, or Certfor chain-of-custody documentation. ISO 50001 energy certification earns points in Chilean tenders. Suppliers with biomass-energy ratios of 50-70% or higher cut CO₂-eq output to 300-400 kg per m³—well below what fossil-fuel-dependent competitors produce.
Surface and finishing: Melamine weight ≥120 g/m², abrasion resistance per EN 14322, gloss specs in GU where relevant. Flatness under 2mm/m.
Supply stability: Annual capacity above 200,000-400,000 m³, backup production lines, on-time delivery at 95-98% or higher over the trailing 12 months, quantity deviation under 3%.
Price and risk: Multi-year contracts (3-5 years) lock FOB pricing 3-7% below spot. Indexed formulas tied to resin and timber prices, capped quarterly increases, take-or-pay terms at 70-80% of forecast volume.
Service: Cut-to-size and CNC capability, Spanish-language technical support, 30-60 days of local buffer stock to absorb shipping delays.
Suppliers like Bayer, with regional warehousing cutting lead times from 45-60 days to 20-30, show what this checklist should reward.
Conclusion
Chile’s MDF market is being reshaped by sustainability mandates, shifting substitute-material competition, and a domestic supply base that can’t fully satisfy specialized demand. That gap is exactly where the opportunity lives. The market rewards suppliers who combine consistent quality, regulatory compliance, and logistical reliability.
For importers, distributors, and manufacturers watching this space, buyer inertia is a liability. Pricing volatility and tightening environmental standards will separate agile players from the rest.
About Baier
Baier supplies MDF, HDF, and engineered wood products for international buyers, combining factory capability, quality control, and export experience to support distributors and project customers.