
Brazil’s forestry advantage—vast eucalyptus and pine plantations feeding a rapidly maturing manufacturing base—has quietly made it a top sourcing destination in the global wood panel trade. For international buyers and trade professionals evaluating the Brazil particle board market, the story is about timing, pricing volatility, and suppliers who deliver at scale with quality.
This report breaks down what’s driving demand across construction and furniture manufacturing, where particle board price trends are heading through 2033, and how Brazil’s cost structure compares to Asian and European competitors. If you’re weighing a sourcing decision or building a supply chain case for leadership, the data ahead will save you weeks of guesswork.
Brazil Particle Board Market Size & Growth Forecast (2024-2033)
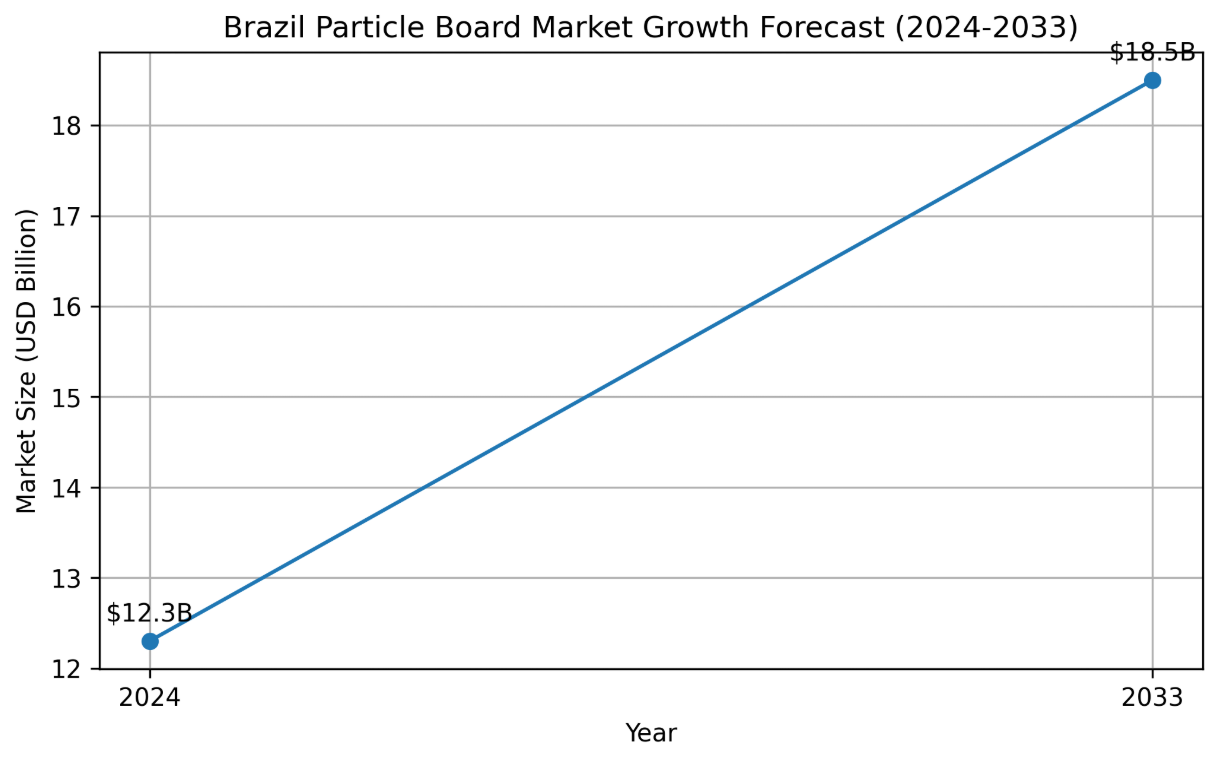
Numbers in this space don’t always agree, and buyers need to know that before they build a forecast around them.
The research says Brazil’s particle board market sits at USD 12.3 billion in 2024, projected to reach USD 18.5 billion by 2033, growing at a 5.5% CAGR. That’s faster than the global particle board market, which is tracking closer to 3.7% CAGR over the same window (USD 24.2bn to 34.8bn).
Here’s the problem. That 12.3bn figure isn’t measuring pure particle board at factory-gate prices. Trade data tells a different story.
IndexBox puts Latin America’s entire wood-based panel market (fiberboard, particle board, plywood combined) at USD 10.6 billion in 2024, with Brazil holding roughly 46% of regional consumption — about 6.9M m³ of particle board specifically. Brazil’s HS 441010 export data (unworked particle board) shows just USD 157.7 million in exports for 2024, against 421,434 tonnes shipped. If Brazil’s particle board market were worth 12.3bn, exports would represent barely 1.3% of that value, which doesn’t match how much of Brazil’s output moves through global trade.
This distinction matters. If you’re pricing supply contracts, work from the narrower physical-volume basis. If you’re building a market-entry business case for leadership, the broader figure may still be useful context — just label it as an upper-bound scenario, not a procurement benchmark.
Key Demand Drivers: Construction & Furniture Manufacturing Sectors
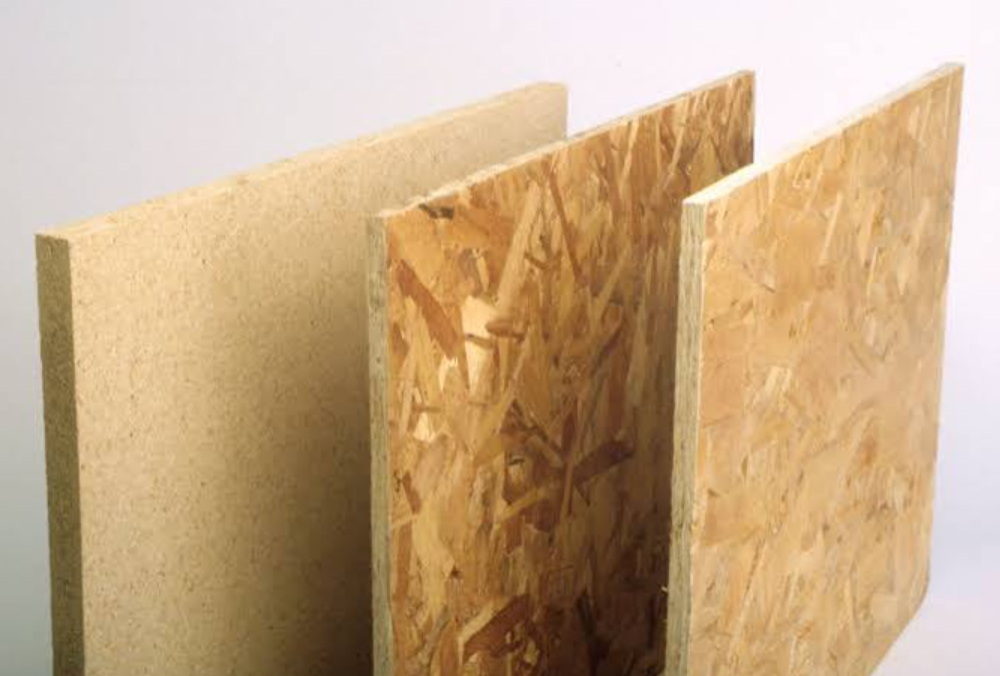
Construction and furniture manufacturing decide whether Brazil’s mills run at capacity or sit idle.
Construction pulls the volume. Urbanization is the real driver. A 1% rise in urban population translates to roughly a 0.8% jump in contracting activity, residential and commercial combined. Apply that ratio to Brazil’s ongoing urban shift, and you get a usable proxy for panel demand growth without waiting on official forecasts. India’s social housing push, targeting 10 million units, generates mass demand for plywood, MDF, and particleboard. The line items are cabinetry, wardrobes, kitchen carcasses, interior door skins. Brazil’s construction materials market is following the same script at a different scale.
Furniture manufacturing pulls the margin. The global furniture market is tracking toward USD 1.09–1.33 trillion by the early 2030s, growing at 5.2–7.0% CAGR depending on the model you trust. For Brazil furniture industry demand, urbanization and space-saving modular furniture alone add an estimated 1.5 percentage points to CAGR. Office workstations, hospitality casegoods, and kitchen cabinet boxes all lean on particleboard and MDF because solid wood doesn’t scale at that cost point.
Add sustainability into the mix. Buyers increasingly favor engineered wood products in Brazil over concrete or steel for carbon reasons, and mills running on plantation fiber and residues can price more competitively while still meeting ESG procurement checklists, giving buyers a genuine negotiation lever when structuring long-term contracts.
Raw Material Supply Chain: Eucalyptus & Pine Plantation Economics
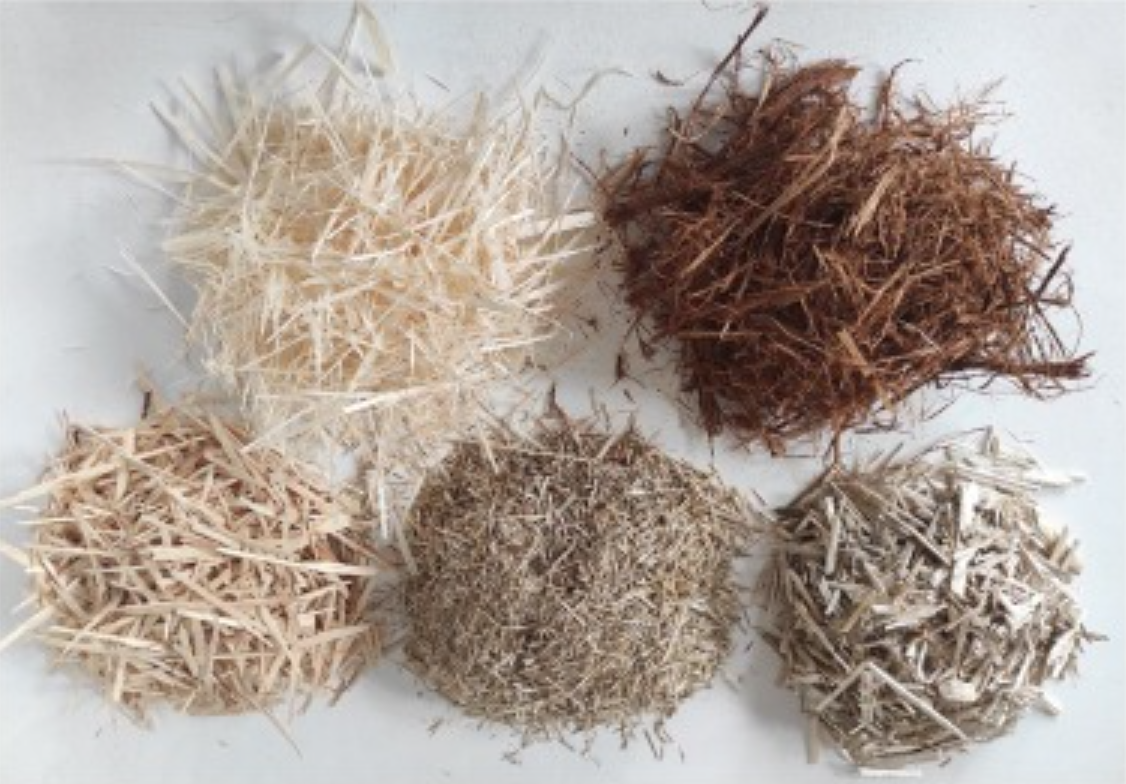
Three states control the wood basket feeding Brazil’s particle board production: Paraná, Santa Catarina, and Rio Grande do Sul. Paraná runs 1.5–1.8 million hectares of eucalyptus and pine plantations, clustered along the Curitiba–Ponta Grossa–Telêmaco Borba corridor. Santa Catarina’s plantations are mostly Pinus taeda and Pinus elliottii, concentrated around Caçador and Lages. Rio Grande do Sul pairs coastal eucalyptus estates with export access through Rio Grande port.
Distance dictates economics here. Mills target 70–80% of log supply within 150 km, with 90% capped at 250 km. Push past that radius and transport costs balloon to 40–60% of delivered wood cost. The math is unforgiving. Shift average haul distance from 100 km to 200 km, and delivered wood price jumps roughly 20%, from R$100 to R$120 per tonne. Since wood represents 55–65% of total manufacturing cost in MDF and particle board, that single variable moves total production cost by 11–13%.
This is why forest-to-panel integrated groups like Duratex/Suzano, Arauco/Flakeboard, and Klabin dominate. Owning 60–70% of their fiber supply insulates them from spot wood price spikes that hit regional, non-integrated mills far harder.
Export Trade Data & Key International Buyer Markets
China buys nearly a third of everything Brazil ships under HS 441010. That single data point changes how you should think about supply risk in the particle board trade between Brazil and the rest of the world.
Where the exports actually go
Brazil’s 2024 export figure of USD 157.7 million splits unevenly across buyer markets:
- China — roughly USD 50.17M, close to 31.8% of total export value. The single largest destination by a wide margin.
- Colombia, Peru, Bolivia, Argentina — smaller but meaningful volumes, each pulling different shares depending on freight cost and tariff treatment.
Track the growth rate, not just the share. Destinations with annual growth above 10% and a five-year CAGR above 5% get the “fast-growing buyer market” label. Everything else sits in the core or supplementary tier, depending on volume and price per kilogram — a decent proxy for margin quality once you divide export value by shipped tonnage.
A note on conflicting figures
You’ll find export totals reported anywhere from USD 113.4M to 157.7M for the same year, sometimes with growth rates that don’t quite reconcile — 40.4% claimed versus roughly 39.1% calculated. The gap almost always traces back to HS code scope, whether re-exports are included, and FOB versus CIF valuation. Before quoting any figure to leadership, confirm which basis it’s built on.
Brazil’s logistics edge
Shipping out of Santos and Paranaguá gives Brazil a real cost advantage into Andean, Central American, and Caribbean markets — shorter transit, lower freight per m³, and often preferential tariffs (0–5%) versus 10–15% for non-regional suppliers. That’s the hub advantage buyers should be pricing into their supplier comparisons.
Price Benchmarks & Cost Structure Analysis for Buyers
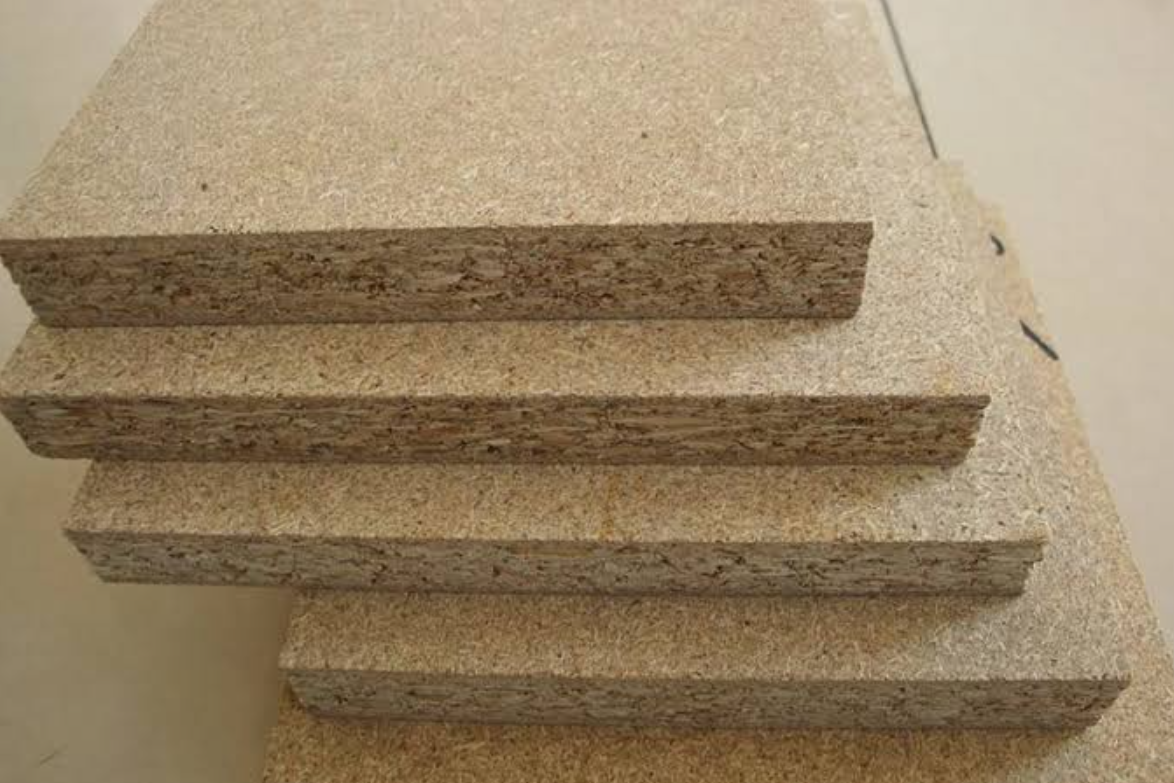
MDF FOB peaked at USD 452/m³ in December 2022. Particle board runs cheaper — lower resin content, lower density, simpler raw material mix — but that gap should be measurable.
Build your comparison the right way. Convert every quote to the same units: m³, thickness, density, tax-inclusive/exclusive, FOB vs. CFR vs. DDP. Skip this step and you’re comparing noise.
Break the quote into cost lines. Supplier pricing splits into raw material (logs/wood chips), resin and chemicals, energy, labor and overhead, freight and margin.
Resin is your best negotiation lever. It’s the most volatile line item. Ask suppliers to disclose resin ratio and glue consumption. Formula “upgrades” often mask margin padding.
Wood cost varies by proximity. Mills near plantation clusters price lower. Unusually high quotes deserve a breakdown of sourcing distance and seasonal premiums.
Separate FOB from landed cost. Freight-heavy panels mean inland transport distance can swing total cost more than factory pricing does.
Use percentile bands to filter quotes. Set the 25th percentile as your floor, the 50th as typical, and the 75th as ceiling. Anything above that needs justification.
Currency clauses matter for long contracts. BRL/USD-linked pricing needs a fixed FX baseline, adjustment frequency, and trigger threshold. Otherwise, renegotiation is inevitable.
Before signing, check the resin/wood/energy/freight ratios, 12-month price history, and get quotes from at least three comparable suppliers.
Brazil vs Global Particle Board Market: Competitive Positioning
Growth rates tell the real story here. Global particle board volume grows at 2.72% CAGR (2026–2031), reaching 141.21M m³ by 2031. Brazil’s value-based CAGR runs at 5.5% — roughly double the global pace. Brazil now produces 55–60% of Latin America’s standard particle board output, making it the region’s supply anchor.
Cost positioning vs Asia
MDF data is a reliable proxy here since fiber and freight structures are similar. Brazilian panels cost 8–10% more than Chinese product — about USD 30/m³. But once you factor in freight to Americas buyers, that gap closes to near-parity. For E1/CARB-P2 grades, Brazil sometimes wins on landed cost.
Where Brazil falls short
Brazilian wood panels rarely replace competitor exports in global trade. Currency exposure makes things worse: BRL swings of ±10–20% annually aren’t unusual. Buyers should lock exchange-rate adjustment clauses into multi-year contracts.
Brazilian Particle Board Manufacturers & Supplier Landscape
Ten companies control roughly 8 million m³ of annual particle board across Brazil. That concentration is the single most important fact for anyone evaluating suppliers here.
Tier-1: the four groups worth building your supply chain around
- Dexco (Duratex) — market leader, 4 lines, 1.8M m³/year, integrated forests-to-flooring (Durafloor)
- Arauco Brazil — 4 lines, 1.44M m³/year, Chilean-owned with heavy MDF/MDP output
- Berneck — Brazil’s largest wood panel exporter, 3 lines, 1.395M m³/year
- Guararapes — 3 lines, 1.14M m³/year
Together, these four control roughly 70% of national MDF capacity. Apply that same ratio to particle board/MDP, and you get a genuinely oligopolistic supplier market, with pricing less competitive than Asian sourcing.
Tier-2: regional specialists worth knowing
Fibraplac, Floraplac, Placas do Brasil, Eucatex, Sudati, and Asperbras/Greenplac round out the supplier universe — call it 5-7 groups total for large-volume buyers. Placas do Brasil stands out for running particleboard, MDP, and OSB in parallel, tuning output to whichever segment (furniture vs. construction) is paying better that quarter.
What this means for sourcing
For orders above 5,000–10,000 m³/year, regional mills (often under 200-300k m³/year combined capacity) can’t anchor your volume alone. Use them as supplemental suppliers. Multi-sourcing across the four Tier-1 groups gives you real negotiating power — that’s typically 3-5 serious national-scale offers. It’s thin compared to more fragmented markets, but still enough to keep pricing honest if you play them against each other.
Practical Buyer Guide: Sourcing Strategy & Risk Assessment
Score suppliers. Comparing quotes without a local network is the biggest mistake buyers make when sourcing sustainable wood panels in Brazil.
Build a weighted scorecard. Capacity stability carries the most weight: 30%. Check monthly output volatility over the trailing 12 months; anything under 15-20% variance signals a reliable partner. On-time delivery should sit at 95%+ with under 5% of orders delayed beyond a week. Capacity utilization between 70-85% is healthy. Push past 90% and delivery risk climbs fast.
Raw material self-sufficiency matters more than most buyers realize. Suppliers owning or leasing 60-70%+ of their fiber supply absorb price shocks better than mills buying spot wood. Anything below 30% self-sufficiency without long-term supply agreements is a red flag.
Certification checklist before you sign anything: – FSC/PEFC forest certification, current and verifiable – ISO 9001 (quality) and ISO 14001 (environmental) – E1 Formaldehyde rating (≤0.124 mg/m³) for furniture-grade orders headed to EU or US markets – Third-party lab reports per batch, with audit rights written into the contract
MOQ and payment structure. Standard particle board MOQs run 1-2 FCL or 50-100 m³ per specification. First orders require a 30% deposit plus balance against shipping documents; established relationships shift to 30-60 day T/T terms.
Currency exposure is the risk nobody prices correctly. BRL swings of 10-20% annually aren’t rare. Forward contracts covering 50-80% of order value, combined with a trigger clause at ±5-7% movement, keep exposure manageable. Cap unhedged single-currency exposure at 30-40% of annual spend.
EUDR compliance is now table stakes. Build in a 6-12 month remediation window for certification gaps, with contractual right to suspend orders if suppliers miss it.
Conclusion
The numbers are clear: Brazil’s particle board market is growing steadily, driven by a construction boom and a furniture manufacturing sector that keeps expanding. What makes this market interesting is the combination of abundant eucalyptus and pine supply, competitive particle board prices, and a manufacturing base that’s focused more on exports.
For buyers and trade decision-makers, timing matters. Brazil’s cost advantages and growing production capacity mean early movers can lock in good supplier relationships before margins tighten. But sourcing well requires due diligence—vetting manufacturers, understanding quality certifications, and building supply chain redundancy.
If you’re thinking about entering this market, don’t wait for the next earnings report. Connect with verified Brazilian suppliers now, ask for current pricing, and start building relationships that will give you a supply chain advantage for the next decade.